Website Tools dashboards deliver tailored insights that help you better understand your website’s content performance. This guide provides a detailed walkthrough of the functionality, metrics, and value each tab delivers, ensuring you can effectively use these tools to enhance your content strategy and audience engagement.
- To access Website Tools, expand the menu on the left side of the screen.
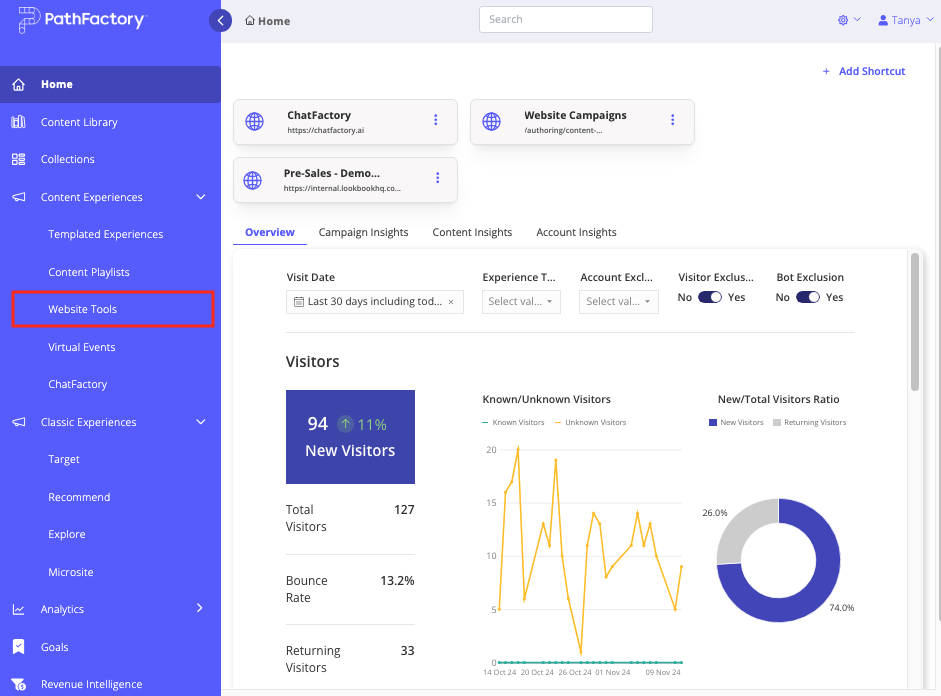 Website Tools menu item
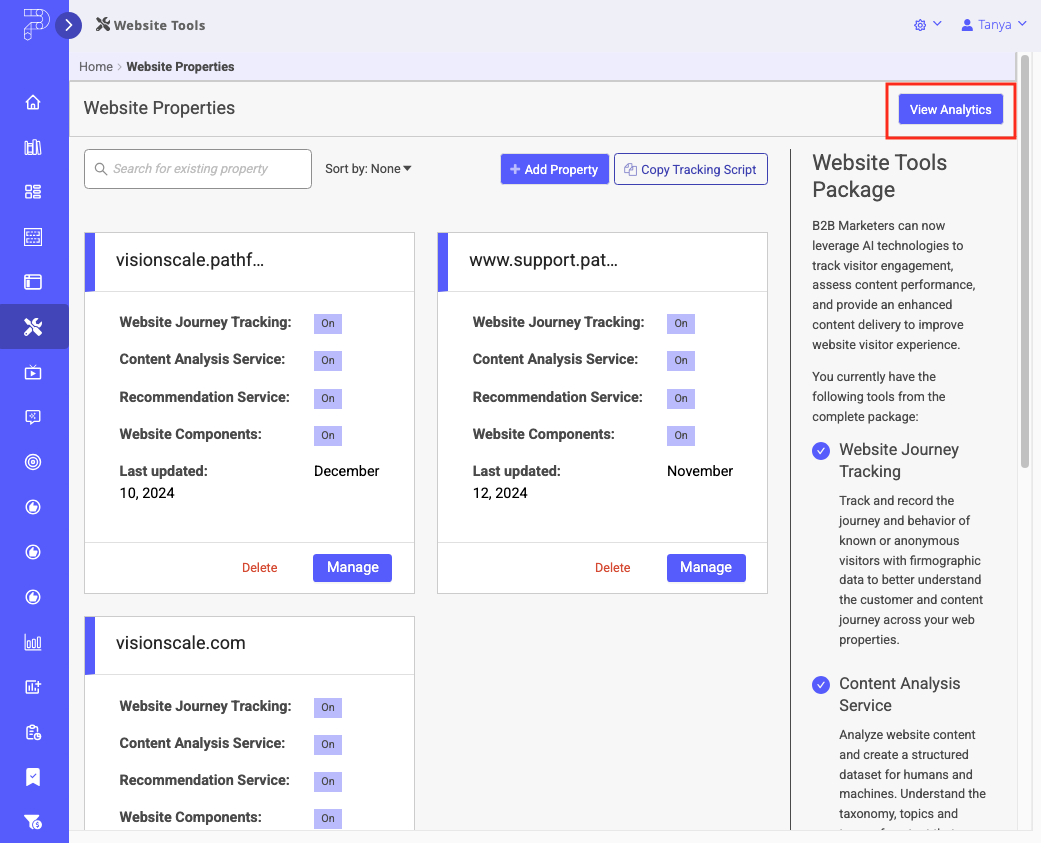
 - In the screen that opens, click View Analytics.
Overview Tab
The Overview tab serves as a cornerstone for understanding overall performance at an aggregate level to identify overall engagement trends based on the filter criteria you choose.
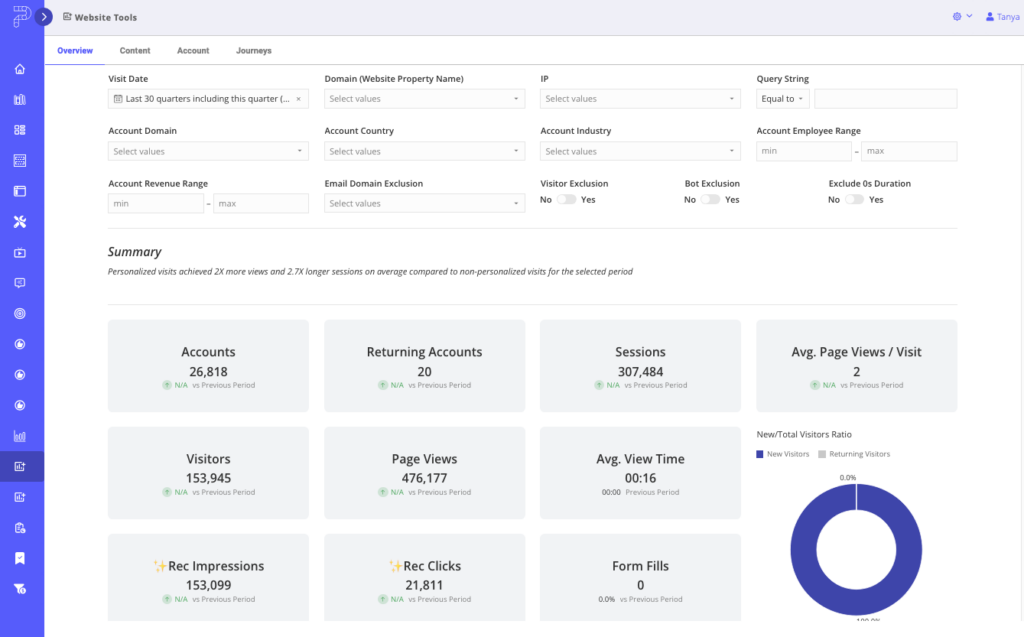
Overview Tab Key Metrics
- Summary: Dynamic summary that provides a quick statement of trend data below it.
- Unique Assets with Traffic: Highlights the variety and reach of your content, helping you identify which assets are resonating with your audience.
- Total Accounts and Visitors: Measures your audience size and engagement, enabling you to gauge marketing effectiveness.
- Average Assets Per Session: Reflects user engagement by indicating how much content is consumed per visit.
- Average Engagement Time Per Asset: Tracks user interaction time to evaluate content quality and relevance.
- Content Binge Rate: Reveals how often users engage with multiple pieces of content in one session, indicating content stickiness.
- Marketing Source and Referrer Details: Provides actionable insights into traffic origins, helping optimize marketing strategies.
Content Tab
The Content tab provides actionable insights that help identify strengths, highlight areas for improvement, and connect user engagement to broader business goals.
The Content tab offers a detailed analysis of content performance across its three subtabs: Guide, Concierge, and All (highlighted in the screen capture below). These sub-tabs allow you to drill into specific engagement metrics and uncover opportunities to optimize your content strategy. By delivering clear insights into user behavior, the Content tab ties engagement metrics to measurable outcomes like conversions and retention.
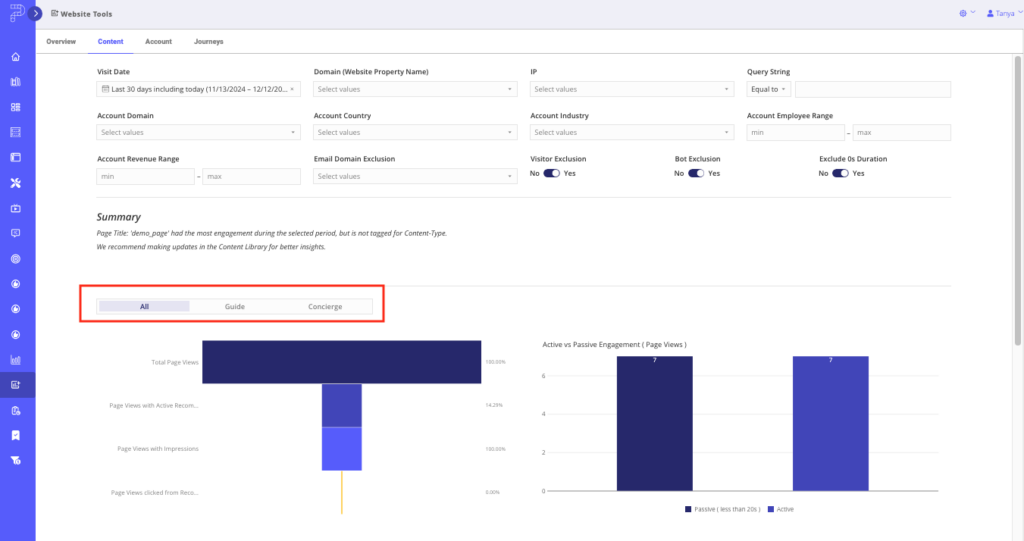
Content Tab Key Metrics
- Summary: This statement identifies the most engaging content asset during the selected timeframe while highlighting areas for improvement, such as tagging updates in the content library. It emphasizes the actionable insights derived from engagement metrics.
- Scroll Depth, Binge Rates, and Average View Time: Understand how deeply users engage with your content and what keeps them hooked.
- Form Fill Data: View form captures linked to specific content (by Name and URL), connecting engagement to lead generation.
- New and Returning Accounts: Measure your ability to attract new users while retaining loyal ones.
- Average Visitors Per Account: Assess account penetration and overall engagement.
- Account Engagement Metrics: Dive deep into session details and engagement time for a comprehensive understanding of account activity.
- Geographic Distribution: Target your content strategies based on regional engagement data.
Account Tab
On the Account tab, you can prioritize high-value accounts, enhance relationships, and adopt a data-driven approach to account management.
The Account Tab delivers an account-centric perspective on content performance. It enables you to analyze activity, refine strategies, and personalize outreach based on detailed engagement data. This tab is invaluable for identifying high-value accounts and tailoring efforts to maximize ROI.
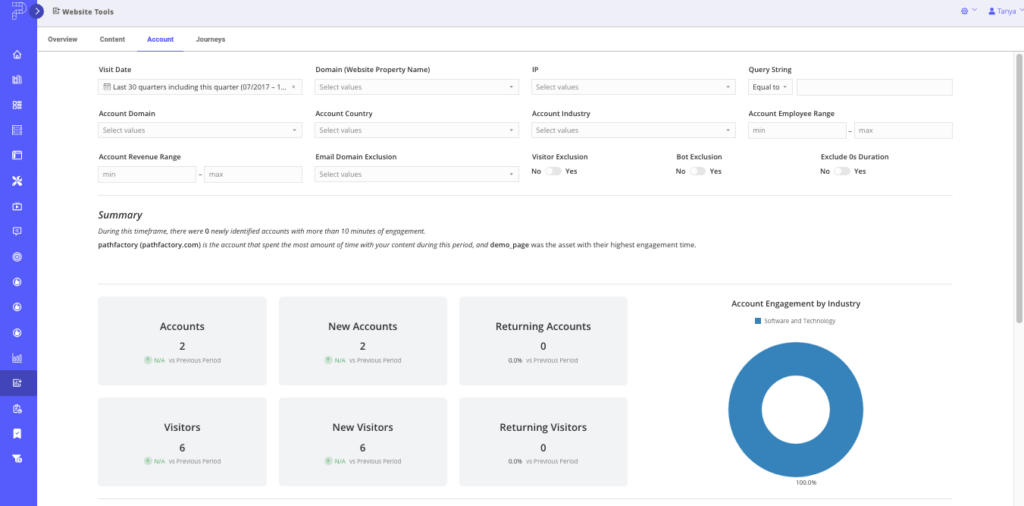
Account Tab Key Metrics
- Summary: The summary reflects account-level activity by indicating newly identified accounts with significant engagement. It serves to highlight potential opportunities for account-based marketing or outreach efforts.
- Unique Accounts and Visitors: Assess your content’s reach and penetration among your audience.
- Assets Consumed and Engagement Time: Understand what resonates at the account level, helping you shape tailored strategies.
- Top Engaging Companies: Focus efforts on high-engagement accounts to strengthen relationships and drive results.
- Detailed Account Summaries: Access granular insights into account behavior, optimizing follow-ups and personalized outreach.
Journeys Tab
The Website Tools Journey Dashboard provides a comprehensive view of how visitors and accounts interact with your website content. It captures and visualizes all engagement activity on pages where the PathFactory tracking script is installed, giving teams a clear understanding of how traffic flows through the site.
This dashboard highlights top trafficked, entry, and exit pages, helping you identify the most impactful touchpoints in a visitor’s journey. Beyond surface-level metrics, it sequences page engagement to uncover common navigation patterns and paths to conversion.
By tying these interactions back to known accounts, the dashboard reveals which companies are engaging with which pages, enabling targeted follow-up and strategic content optimization. This view makes it easier to spot high-value pages, drop-off points, and opportunities to improve website performance and buyer engagement.

- Sessions, Visitors & Engagement:
Gain a clear picture of overall website traffic and visitor behavior. Understand how many visitors are engaging, how often they return, and how long they stay. - Top Entry, Exit & Journey Pages:
Identify the most impactful pages in your website experience. These insights help you optimize high-traffic entry points and reduce friction at common exit points. - Page-Level Engagement:
Measure how deeply visitors interact with each page. Metrics like average time spent, scroll depth, and completion rates reveal which content truly captures attention. - Journey Sequencing & CTR:
See how visitors navigate through the site step by step. By analyzing page view order and click-through rates on recommendations, you can surface the content paths that drive continued engagement. - Account Engagement:
Understand which accounts are consuming which content, providing a foundation for targeted outreach and personalized website experiences. - Form Captures & Conversions:
Track how well pages and journeys convert visitors into leads. Form capture and conversion metrics help tie engagement directly to business outcomes.
Views: 219
