Accounts Overview
The accounts tab gives you insight into your account penetration, and helps you answer the following questions:
- Which accounts are most engaged with your content?
- What content is generating the most engagement from your target accounts?
- What topics are trending with your target accounts?
|
Note
|
As of April 16th, 2020, all Account Identification within PathFactory is provided by 6sense by default. We also support integrations with Demandbase for customers with eligible Demandbase licensing. Contact your CSM to learn more! |
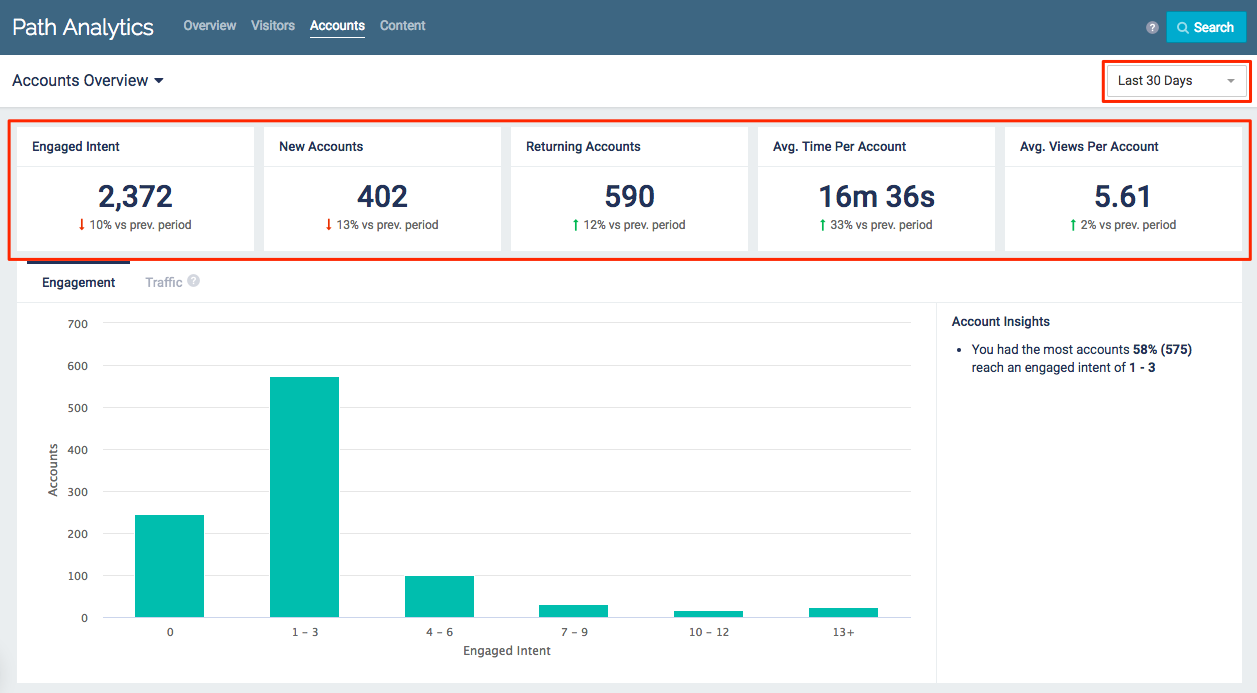
Path Analytics main page
|
Note
|
Use the drop-down menu in the top right corner to select a time frame. All data displayed will be from the selected period of time (7, 30, 60, 90, or 365 days). |
Engaged Intent: The total engagement score earned by accounts viewing your content during the selected time frame.
|
Note
|
This number will be different than the Engaged Intent displayed on the Path Analytics Dashboard. The Dashboard displays the engaged intent of all visitors; the Accounts Overview page displays the engaged intent of all visitors which are associated with an account. |
New Accounts: The total number of accounts which engaged with any of your content for the first time during the selected time frame.
Returning Accounts: The total number of accounts which engaged with your content for the first time before the selected time frame, and which returned to view content during the current time frame.
Avg. Time per Account: The average amount of time accounts spent viewing your content during the selected time frame. This is calculated by dividing the total amount of time all identified accounts spent viewing content during the time frame by the number of accounts who viewed content.
Avg. Views per Account: The average number of content asset page views achieved by an account. This is calculated by dividing the total number of content asset page views during the time frame by the number of accounts who viewed content.
Engagement Chart
This chart shows you how much accounts are engaging with your content, grouped by the Engaged Intent score they achieved.
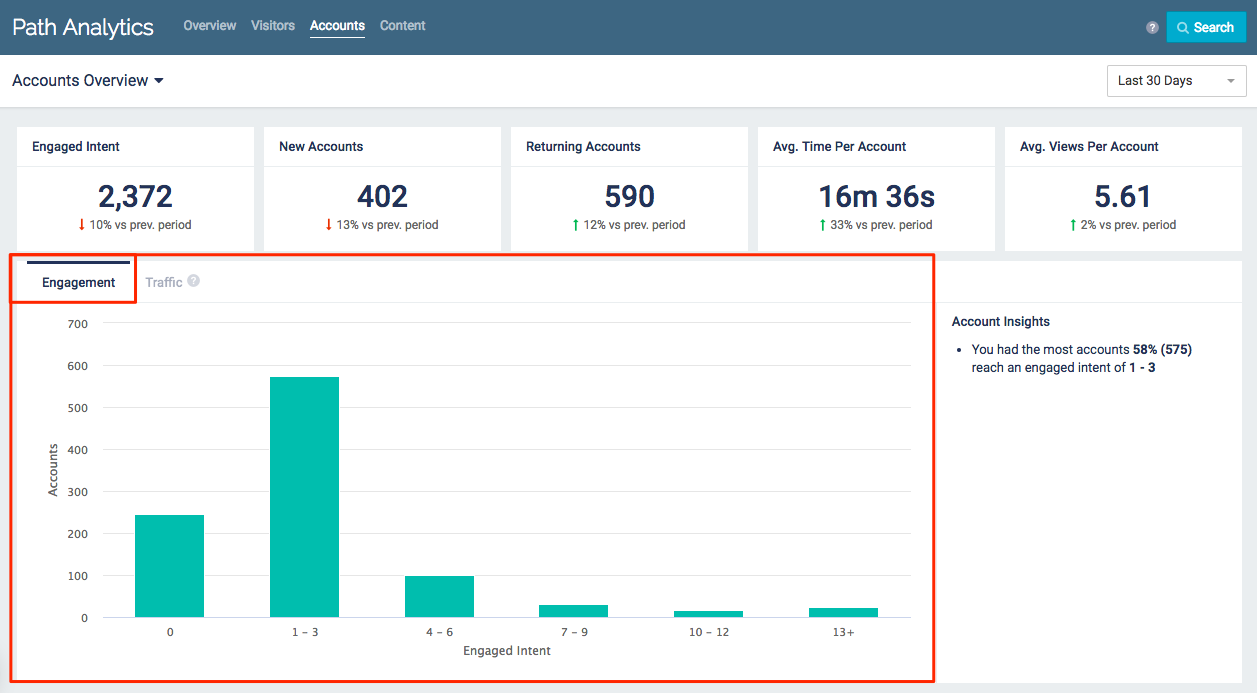
Engagement Chart Example
- Hover over the bars to see how many accounts earned that Engaged Intent score
- Use the drop-down menu in the top right corner to select a time frame. All data displayed will be from the selected period of time (7, 30, 60, 90, or 365 days).
Traffic Chart
This chart displays the number of new and returning accounts which viewed your content during the selected period.
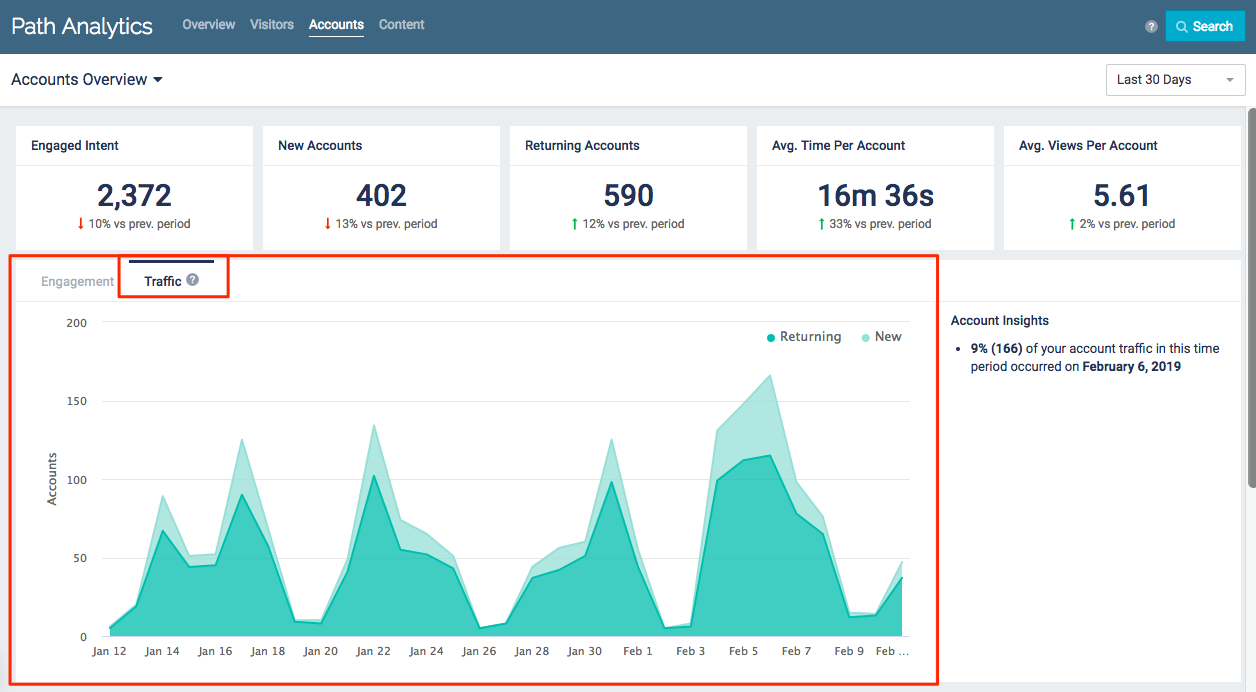
Traffic Chart Example
- Returning Accounts are accounts which have previously viewed a Content Track
- New Accounts are accounts which viewed a Content Track for the first time on that day
- Use the drop-down menu in the top right corner to select a time frame. All data displayed will be from the selected period of time (7, 30, 60, 90, or 365 days).
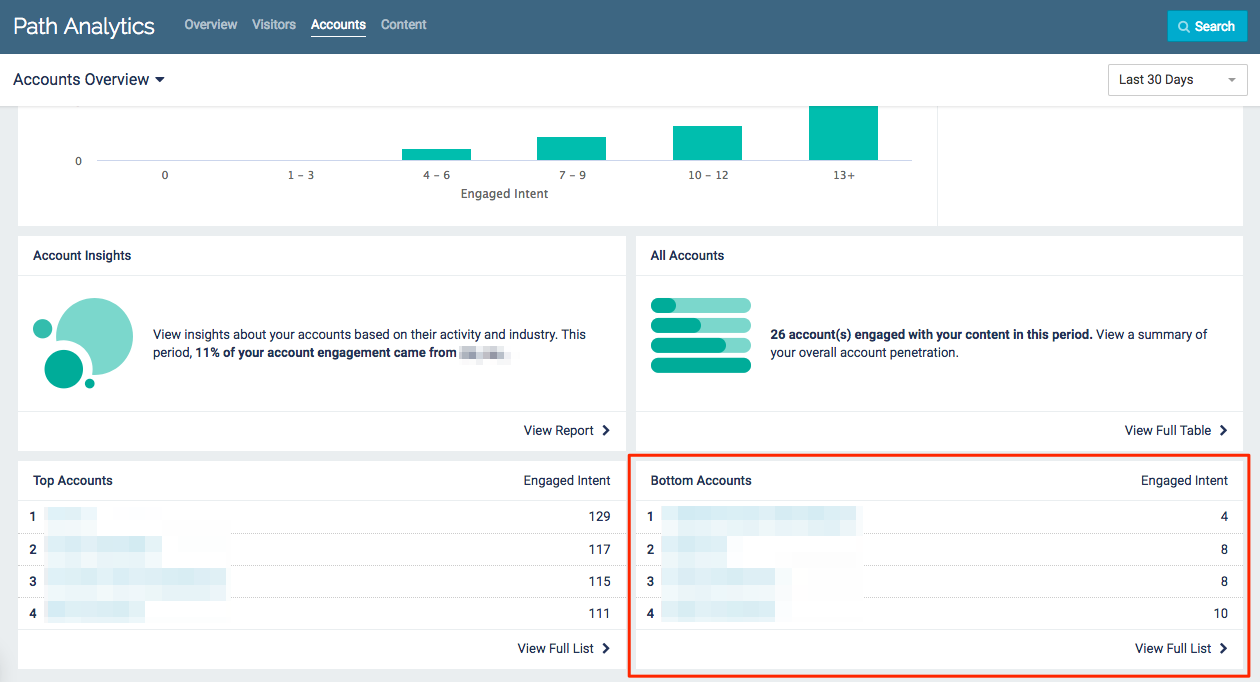
Top Accounts
Your 4 most-engaged accounts from the selected time frame are listed here, ranked by Engaged Intent.
- Click through to see more of your Top Accounts
- Click on any account to access more detailed data on that specific account
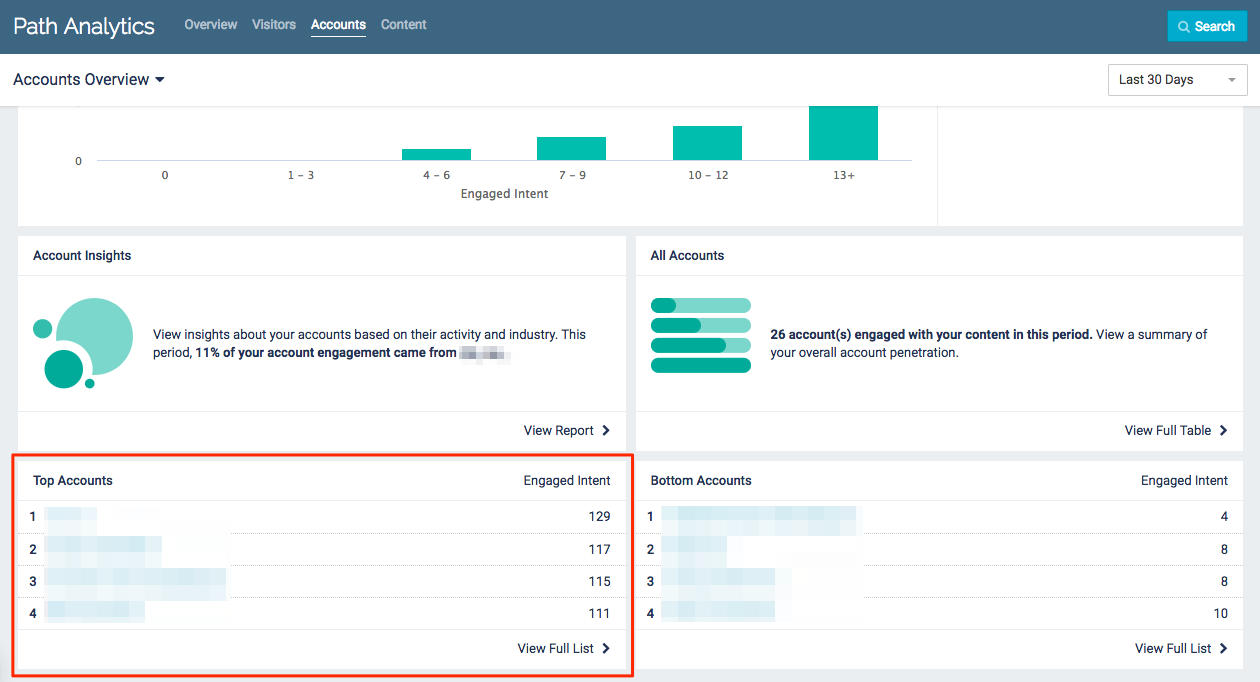
Accounts Overview page
Bottom Accounts
Your 4 least-engaged accounts from the selected time frame are listed here, ranked by Engaged Intent.
- Click through to see more of your Bottom Accounts
- Click on any account to access more detailed data on that specific account
Bottom Accounts example
All Accounts
The All Accounts table provides a list of all new and returning accounts which have viewed content within the selected time frame.
- Click on the column headings to sort by that attribute.
- Click on any account to access more detailed data on that specific account
- Use the drop-down menu in the top right corner to select a time frame. All data displayed will be from the selected period of time (7, 30, 60, 90, or 365 days).
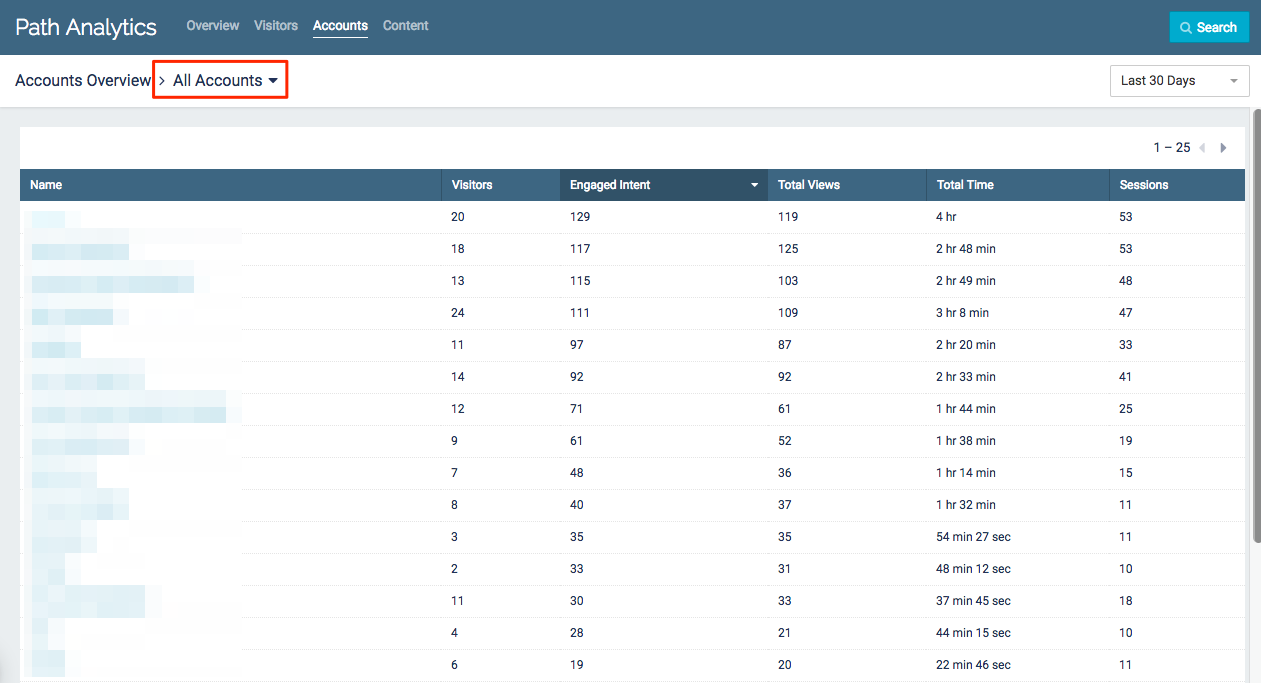
All Accounts table
Visitors: Total number of visitors from the account who viewed your content during the selected time frame
Engaged Intent: The total engagement score earned by visitors from the account while viewing your content during the selected time frame.
|
Note
|
For more information on how Engaged Intent is defined, see the glossary. |
Total Views: Total number of pageviews by visitors from the account during the selected time frame.
Total Time: Total amount of time visitors from this account spent viewing your Content Tracks during the selected time frame
Sessions: Total number of sessions the visitors from this account had with your Content Tracks during the selected time frame
Specific Account
Select an account from anywhere in Path Analytics to get deeper insights into how that particular account engaged with your content.
|
Note
|
Know which account you’re looking for? Use the search bar to quickly find a specific account! |
- Use the drop-down menu in the top right corner to select a time frame. All data displayed will be from the selected period of time (7, 30, 60, 90, or 365 days).
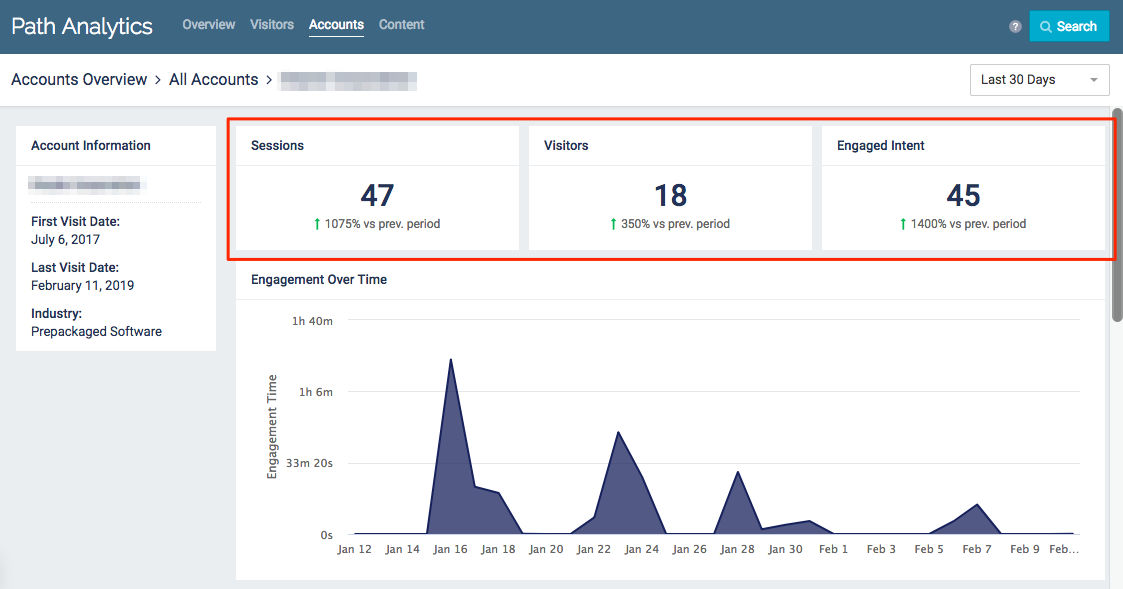
All Accounts overview
Sessions: Total number of sessions of all visitors from the account.
|
Note
|
For more information on how sessions are defined, see the glossary. |
Visitors: Total number of visitors from the account who viewed your Content Tracks during the selected time frame.
Engaged Intent: The total engagement score earned by accounts viewing your content during the selected time frame.
|
Note
|
For more information on how Engaged Intent is defined, see the glossary. |
Engagement Over Time
This graph displays the engagement of all visitors from the account over the selected time frame.
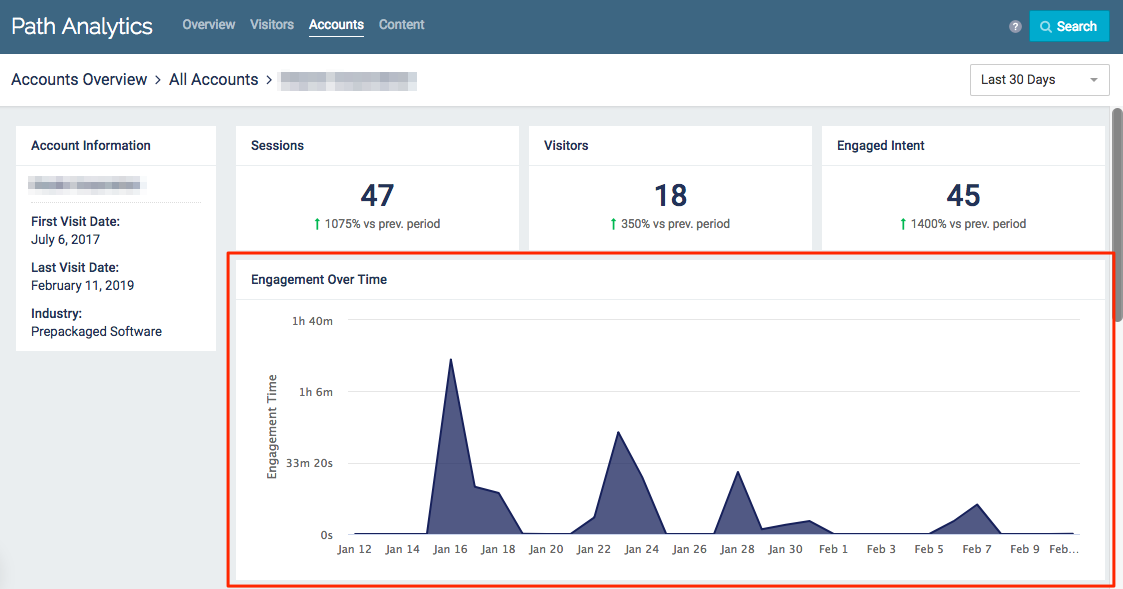
Engagement Over Time example
- Hover over any point in the graph for more information on engagement on a specific day
- Total Time: Total amount of time visitors from this account spent viewing your Content Tracks on a specific day
- Visitors: Total number of visitors from this account who viewed your Content Tracks on a specific day
- Sessions: Total number of sessions from all visitors from this account
Top 5
View lists of what visitors from the account are most engaged with.
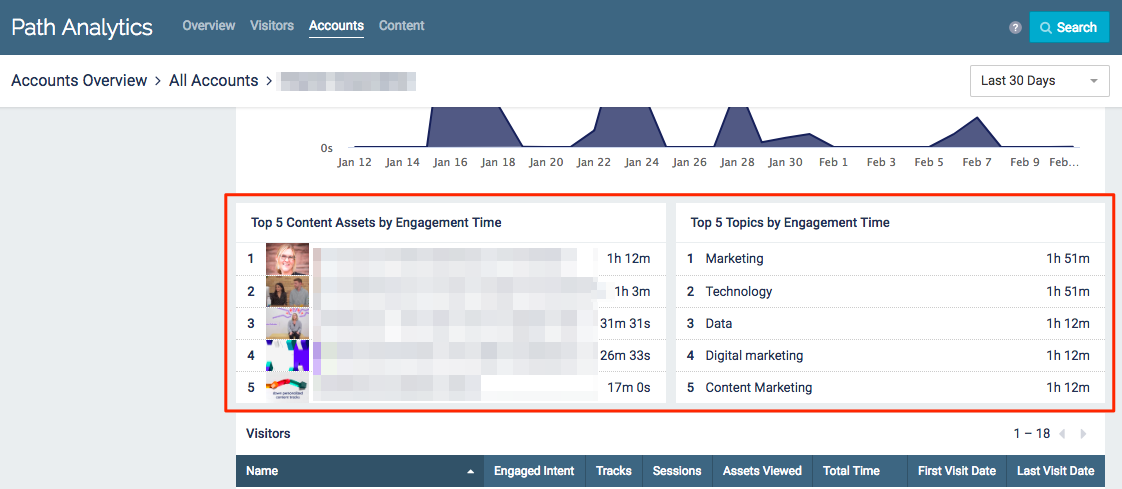
Top 5 Visitors example
- Top 5 content assets which visitors from the account viewed during the selected time frame
- Top 5 topics visitors from the account engaged with during the selected time frame
Visitors Table
This table lists all known and unknown visitors from the account.
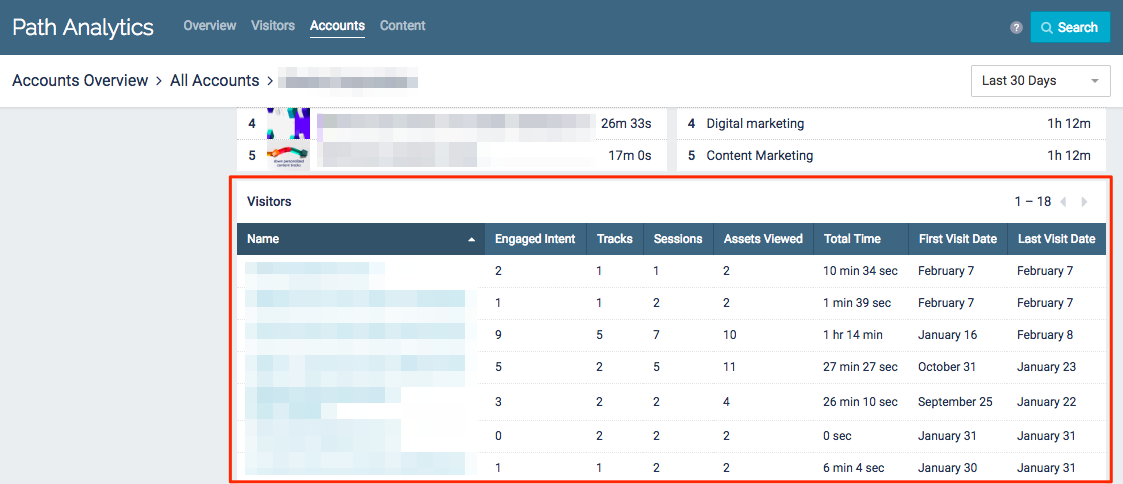
Visitors Table example
Name: Name or unique ID of visitor.
Engaged Intent: Total engagement score earned by the visitor from engaging with content during all of their sessions.
Tracks: Total number of content tracks viewed by the visitor during all of their sessions.
Sessions: Total number of sessions the visitor had with your Content Tracks.
|
Note
|
For more information on sessions, see the glossary. |
Assets Viewed: Total number of content assets the visitor viewed.
Total Time: Total amount of time the visitor spent viewing content during all of their sessions.
First Visit Date: The date of the visitor’s first visit to your content.
Last Visit Date: The date of the visitor’s most recent visit to your content.
Top Accounts
The Top Accounts table provides a list of the 20 accounts with the most Engaged Intent during the selected time frame.
- Click on any account to access more detailed data on that specific account
- Use the drop-down menu in the top right corner to select a time frame. All data displayed will be from the selected period of time (7, 30, 60, 90, or 365 days).
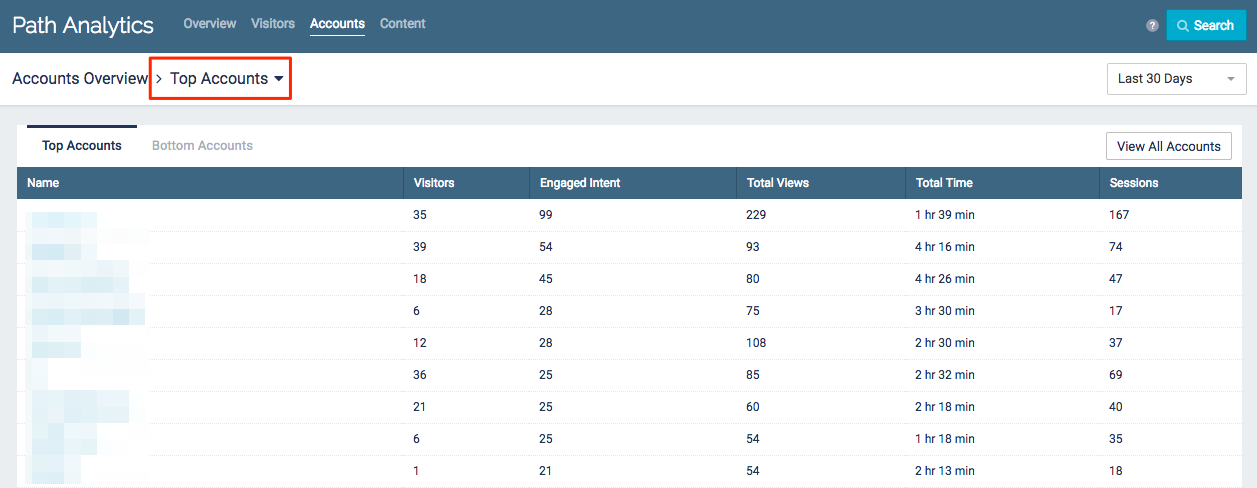
Top Accounts example
Visitors: Total number of visitors from the account who viewed your content during the selected time frame
Engaged Intent: The total engagement score earned by visitors from the account while viewing your content during the selected time frame.
|
Note
|
For more information on how Engaged Intent is defined, see the glossary. |
Total Views: Total number of pageviews by visitors from the account during the selected time frame.
Total Time: Total amount of time visitors from this account spent viewing your Content Tracks during the selected time frame
Sessions: Total number of sessions the visitors from this account had with your Content Tracks during the selected time frame
Bottom Accounts
The Bottom Accounts table provides a list of the 20 accounts with the least Engaged Intent during the selected time frame.
- Click on any account to access more detailed data on that specific account
- Use the drop-down menu in the top right corner to select a time frame. All data displayed will be from the selected period of time (7, 30, 60, 90, or 365 days).
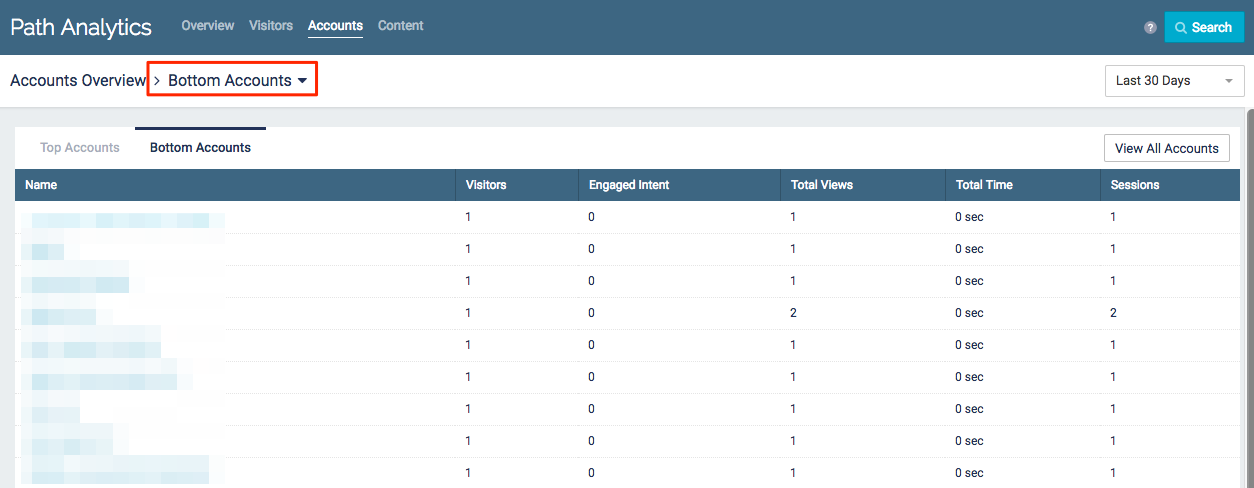
Bottom Accounts example
Visitors: Total number of visitors from the account who viewed your content during the selected time frame
Engaged Intent: The total engagement score earned by visitors from the account while viewing your content during the selected time frame.
|
Note
|
For more information on how Engaged Intent is defined, see the glossary. |
Total Views: Total number of page views by visitors from the account during the selected time frame.
Total Time: Total amount of time visitors from this account spent viewing your Content Tracks during the selected time frame
Sessions: Total number of sessions the visitors from this account had with your Content Tracks during the selected time frame
Account Insights
There are 2 bubble charts available under Account Insights: Activity and Industry.
Accounts by Activity
This chart displays accounts which have viewed your Content Tracks during the selected time frame.
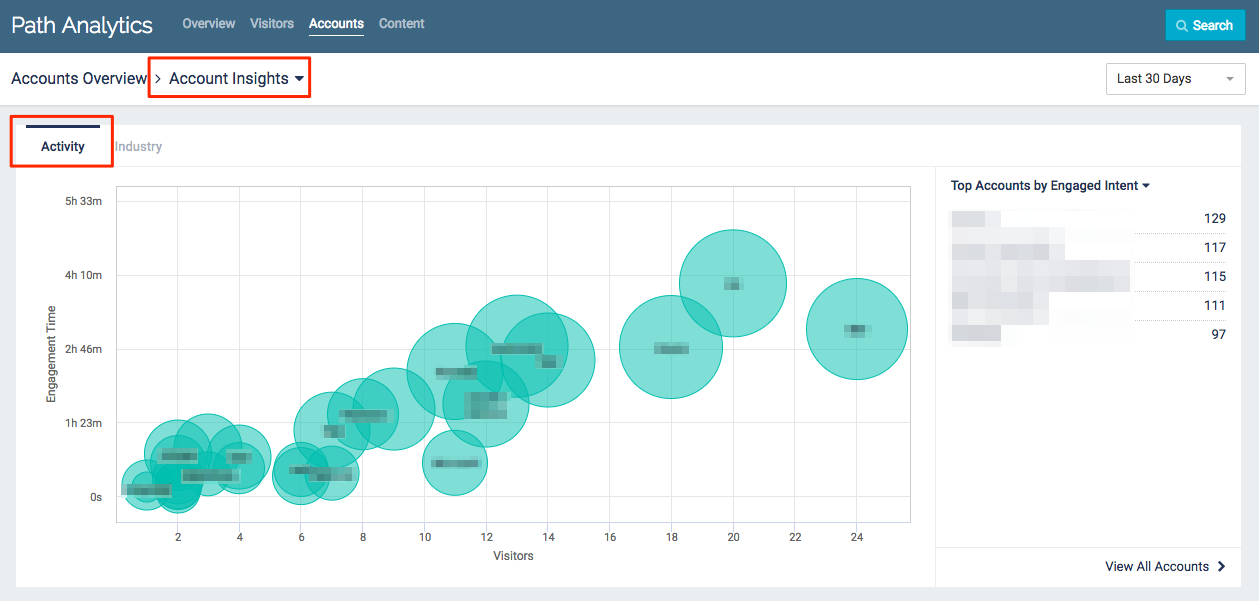
Accounts By Activity example
- Bubble size is determined by Engaged Intent
- Bigger bubbles represent higher Engaged Intent
- Hover over a bubble for more information about the account
- Visitors: Total number of visitors from the account which viewed your content during the selected time frame
- Engagement Time: Total amount of time visitors from the account spent viewing your content during the selected time frame
- Engaged Intent: The total engagement score earned by the account during the selected time frame.
|
Note
|
For more information on how Engaged Intent is defined, see the glossary. |
Accounts by Industry
This chart groups your visitors by industry.
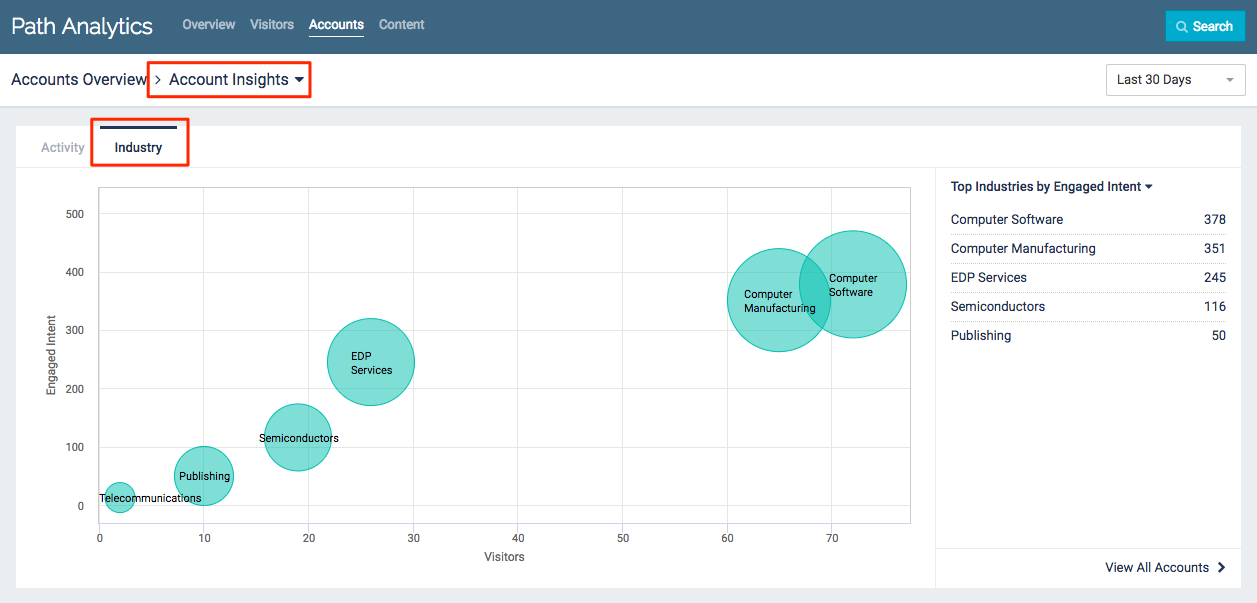
Accounts by Industry Example
|
Note
|
Only known and unknown visitors who have an account (and therefore industry) associated with them will be included in this chart. |
- Bubble size is determined by Engagement Time
- Hover over a bubble for more information about the account
- Visitors: Total number of visitors from the industry which viewed your content during the selected time frame
- Engagement Time: Total amount of time visitors from the industry spent viewing your content during the selected time frame
- Engaged Intent: The total engagement score earned by visitors from the industry during the selected time frame.
|
Note
|
For more information on how Engaged Intent is defined, see the glossary. |
Opportunity Influence
|
Warning
|
This page will only be populated if you have set up the PathFactory integration with Salesforce. This feature is currently in Controlled Availability; contact support or your CSM for more information. |
Account Opportunity Influence Bubble Chart
This chart displays the open and/or closed-won opportunities which were influenced by PathFactory.
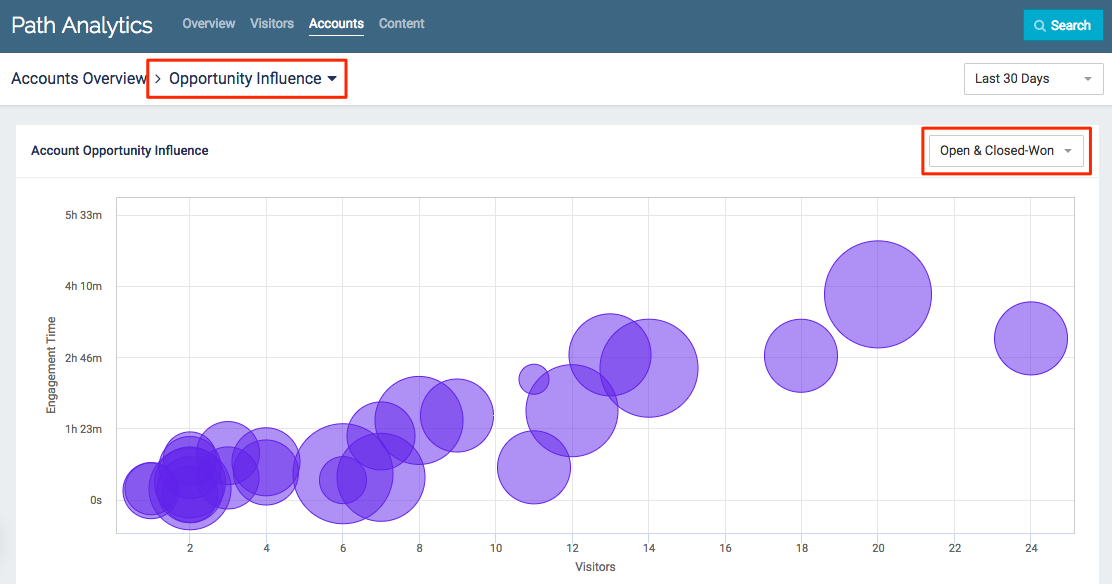
Opportunity Influence example
- Bubble size is determined by total opportunity size
- Hover over a bubble for more information about the account
- Visitors: Total number of visitors from the account which viewed your content during the selected time frame
- Engagement Time: Total amount of time visitors from the account spent viewing your content during the selected time frame
- Total Opportunity Size: Total dollar amount of the account’s open and closed-won opportunities
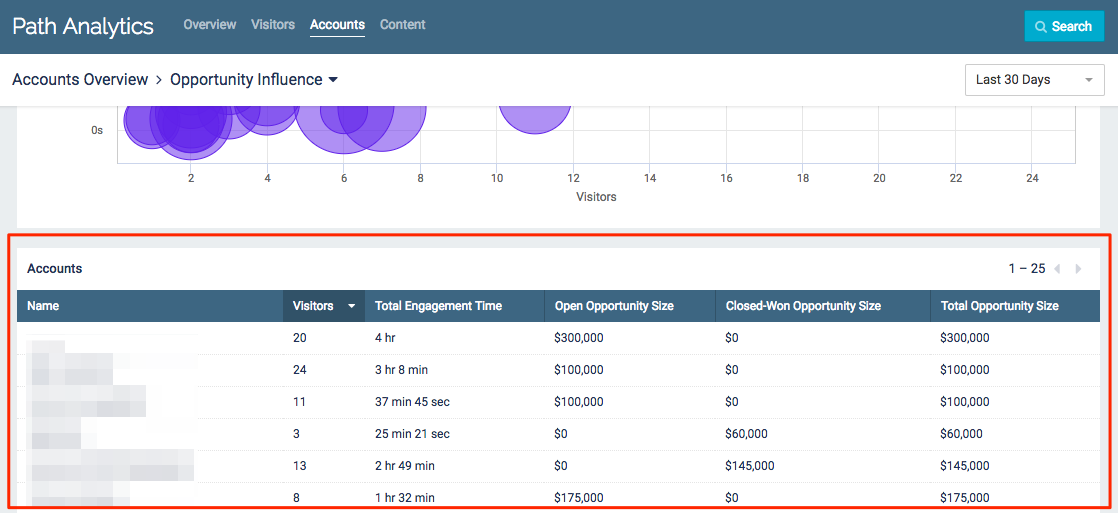
Accounts Table
This table lists all accounts which have viewed your Content Tracks.
Opportunity Influence example
- Sort the table according to any column by clicking the column heading
- Use the drop-down menu in the top right corner to select a time frame. All data displayed will be from the selected period of time (7, 30, 60, 90, or 365 days).
Visitors: The total number of visitors from the account who viewed your content within the selected time frame
Total Engagement Time: Total amount of time all visitors from the account spent viewing your Content Tracks during the selected time frame
Open Opportunity Size: The total dollar amount from the account’s open opportunities
Closed-Won Opportunity Size: The total dollar amount from the account’s closed-won opportunities
Total Opportunity Size: The total dollar amount of the account’s open and closed-won opportunities
Views: 237