Explore Pages in PathFactory enable you to present all content assets within a specific track, while giving your visitors the flexibility to choose their own path through your content in a resource center like experience. This article explains how you can actively analyze the engagement and performance of your Explore Pages and their content assets. By viewing detailed performance metrics, you can monitor visitor engagement and assess conversion rates, enabling you to fine-tune your Explore Pages for improved performance and audience engagement.
For more information on what Explore Pages are and how to use them, read the article, Introduction to Explore.
To view the performance data for an Explore Page, follow the instructions below.
- In PathFactory, expand the left menu panel and then within the Classic Experiences section, click Explore.
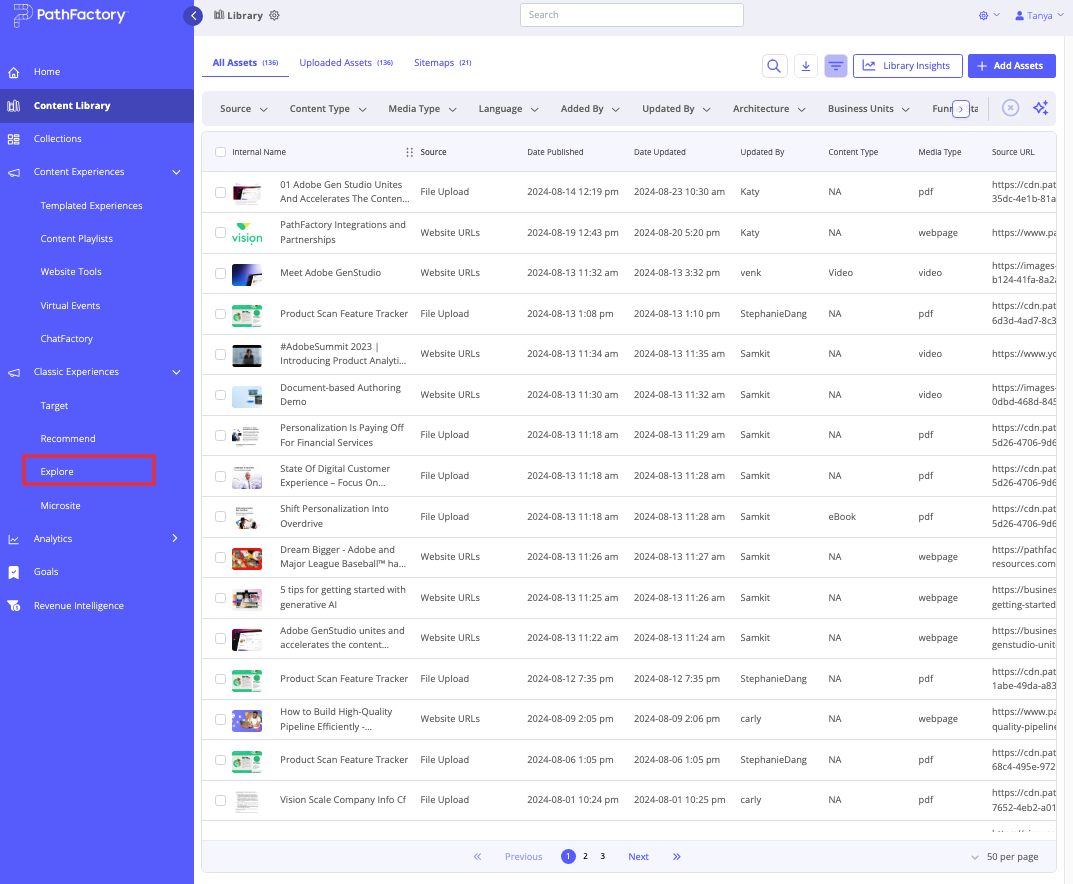
- A list of Explore Pages appears.
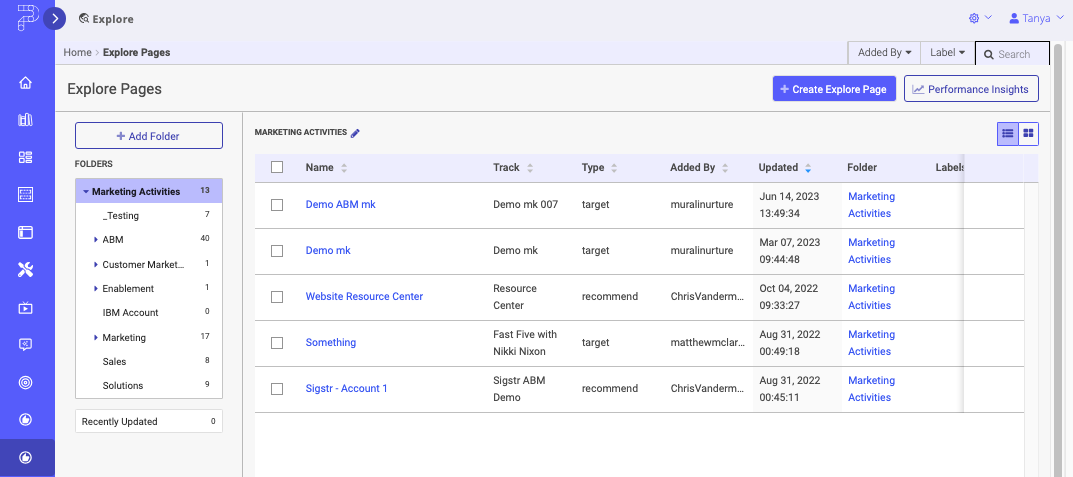
- To view detailed analytics about the performance of a specific Explore Page, click on the title of the Explore Page in the list. In the resulting screen, click the Analytics button.

- You now see a breakdown of the performance for the given Explore Page, complete with filters at the top to help narrow down search results and view specific metrics.
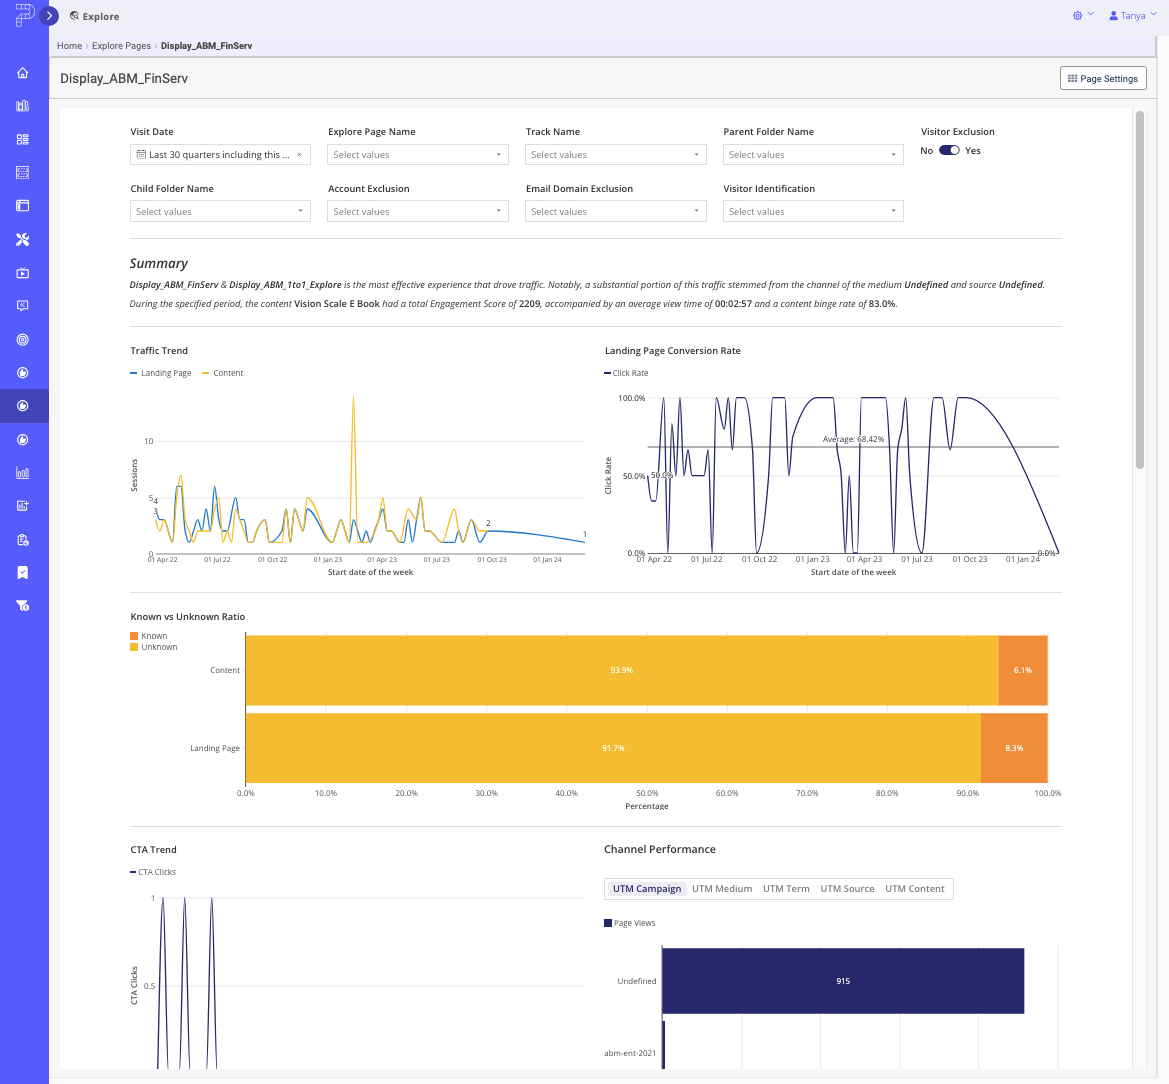
The analytics provided here are described below:
- Traffic Trend – This graph displays the number of visitors over time, allowing you to track how traffic to the Explore Page fluctuates during the selected period.
- Landing Page Conversion Rate – This graph shows the percentage of visitors who completed a desired action (e.g., filling out a form, clicking a CTA) on the Landing Page, helping you assess the effectiveness of the page in driving more content consumption and conversions.
- Known vs Unknown Ratio – This metric compares the proportion of visitors who are identified (known) versus those who remain anonymous (unknown), providing insight into their engagement and conversion patterns.
- CTA Trend – This graph tracks the performance of Call-to-Action (CTA) elements over time, showing how often CTAs are clicked and their effectiveness in engaging visitors.
- Channel Performance – This graph breaks down visitor traffic by channel (campaign, source type, content and more) to show which sources are driving the most engagement and conversions.
Note: Channel performance data and reporting is dependent on marketers properly using UTM codes when activating PathFactory Experiences.
Explore Page Performance Data Tables
Lower on the Explore Page Analysis page, you’ll see data tables with detailed views of your analytics that you can filter on screen or export for further analysis.
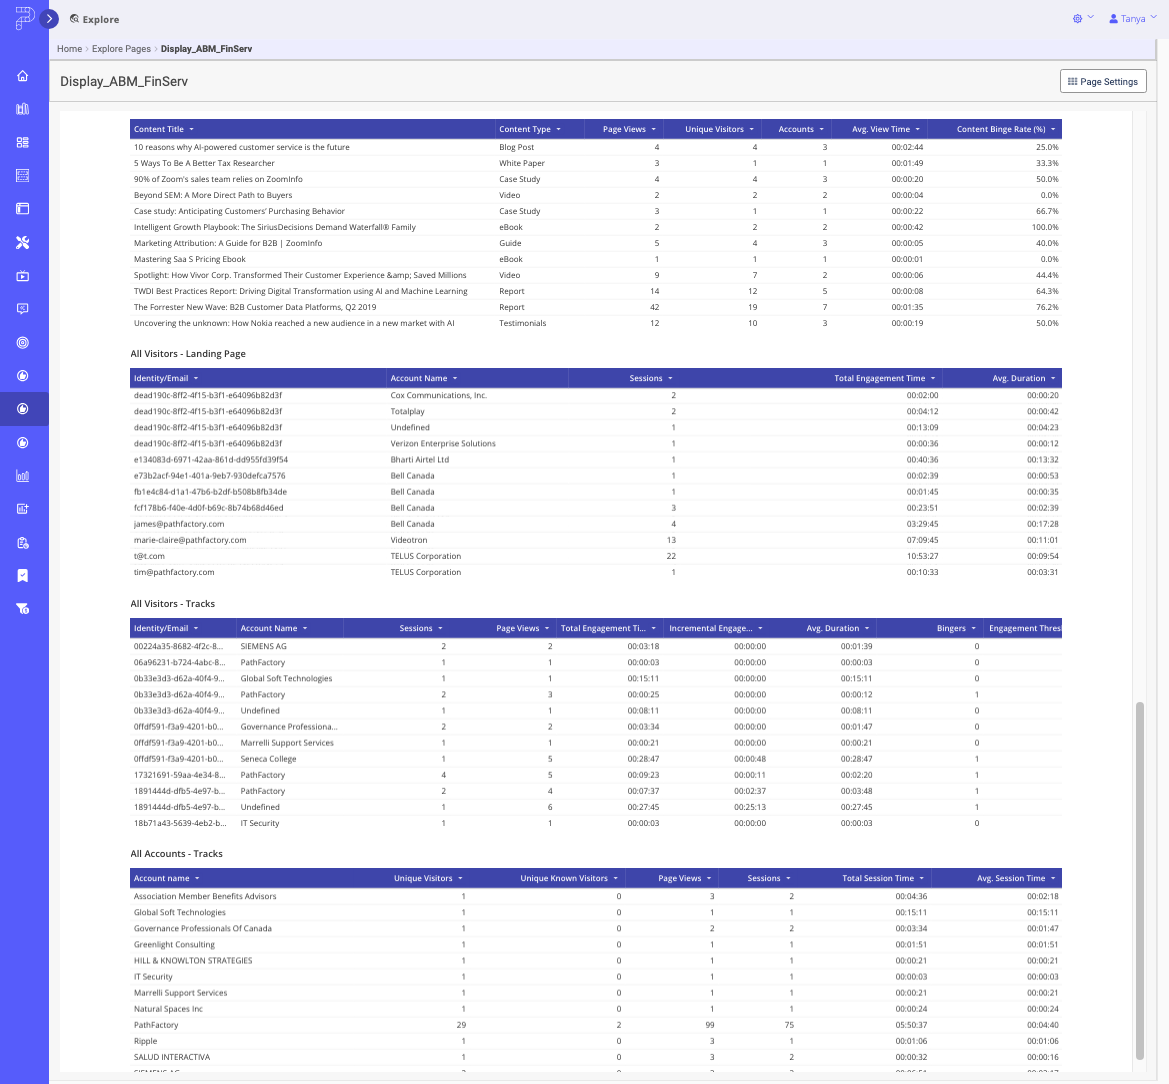
- Explore Landing Page Performance – This table presents key metrics related to the performance of the Explore Page, including visitor activity, engagement, and interaction rates. It provides insights into areas such as visitor sessions, page views, conversion actions, and overall engagement, helping you assess the effectiveness of the landing page.
- Tracks Performance – This table lists performance metrics for the different content tracks associated with the Explore Page, such as visitor engagement, completion rates, and track-specific interactions.
- Content Performance – This table displays performance metrics for individual content assets within the Explore Page, including views, engagement time, and conversion actions associated with each piece of content.
- All Visitors for Landing Page – This table offers a comprehensive view of all visitor interactions with the Landing Page, including metrics like page views, sessions, and visitor behavior patterns.
- All Visitors Tracks – This table provides detailed insights into visitor interactions with the content tracks, showing which tracks are most popular and how visitors engage with the content within each track.
- All Accounts Tracks – This table breaks down track performance by account, showing how different accounts interact with the content tracks, including metrics like engagement levels, session counts, and content consumption.
By regularly reviewing the performance analytics of your Explore Pages, you can gain valuable insights into how visitors are engaging with your content and make data-driven decisions to optimize both engagement and conversions. The detailed metrics provided, from traffic trends to content-specific performance, allow you to fine-tune your Explore Pages, ensuring they deliver a more effective and personalized content experience. Use these analytics to continuously improve your strategies and maximize the impact of your content.
Views: 72