Google Analytics/PathFactory Integration
High-level Page-View Screens
This article will briefly show you what PathFactory data can look like in Google Analytics. This is not exhaustive as each organization answers different questions with this data. This article hopes to simply orient you to what the data can look like and how it is organized and can be visualized.
What it does
Integrating Google Analytics with your PathFactory instance will enable you to view rich page view data related to your content tracks in your Google Analytics reports and dashboards.
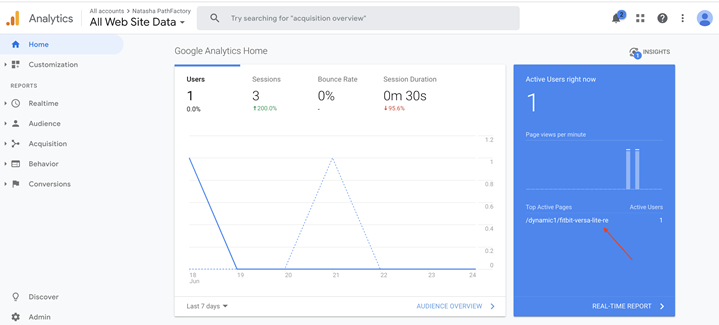 Example of Google Analytics report
Suppose your visitor is browsing your track; specifically asset #4 in your track
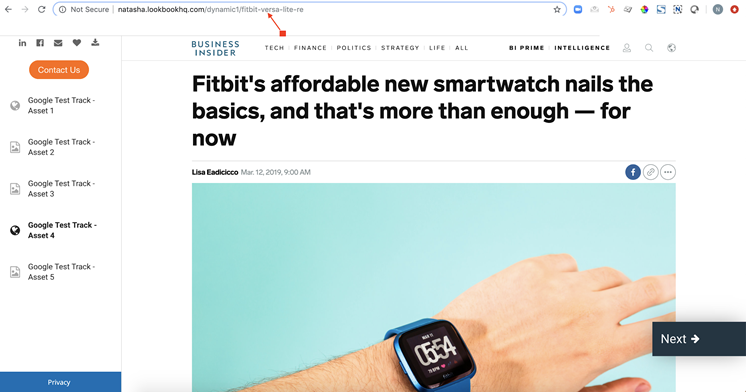
Google Analytics tracks the visitors session data, related to the individual assets viewed, as page views. Notice that the active page aka the active asset the visitor is viewing in the track is the page the visitor is currently browsing
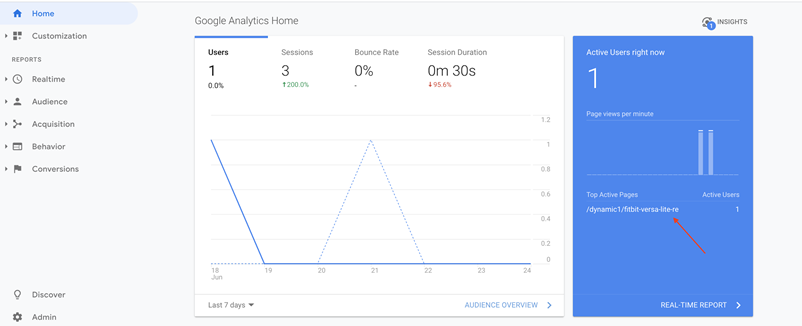
Google Analytics Home
Top active pages (or individual content assets) can be tracked in realtime
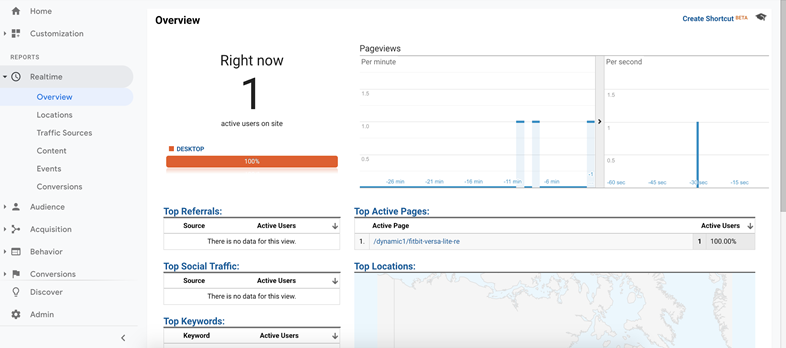
You can also see audience insights on particular assets
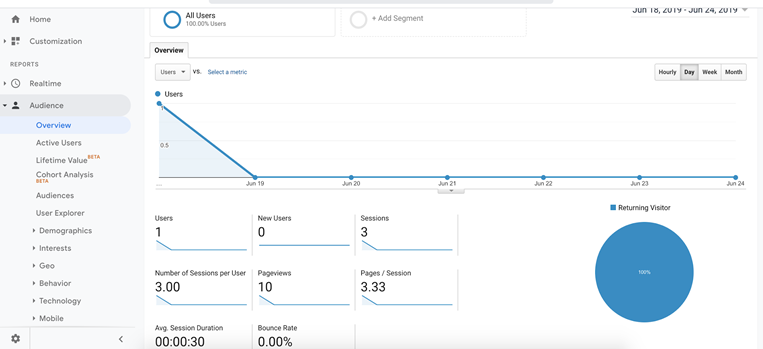
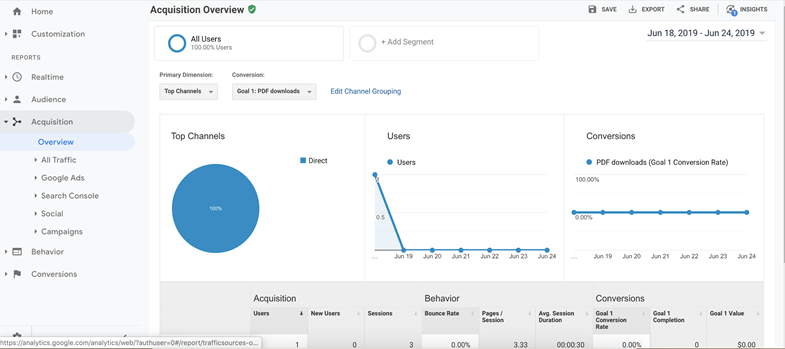
Or, you can see visitor acquisition channels showing you where visitors to your tracks originate from, and even set goals just as you would for your web pages. In this case a PDF download of the asset is the goal
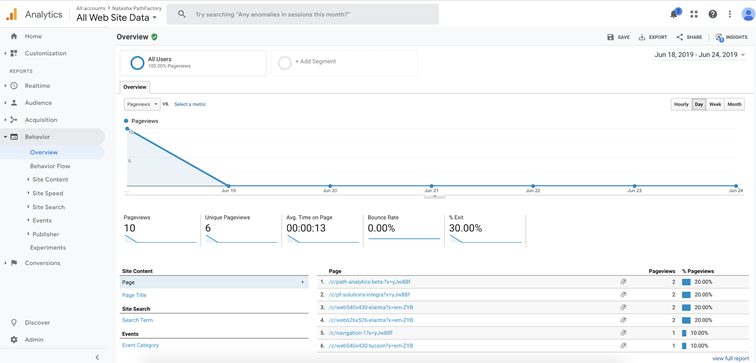
Visitor behavior; this is how they interact with all the assets in your track, seen as a clickstream. Each asset viewed is a page as seen below.
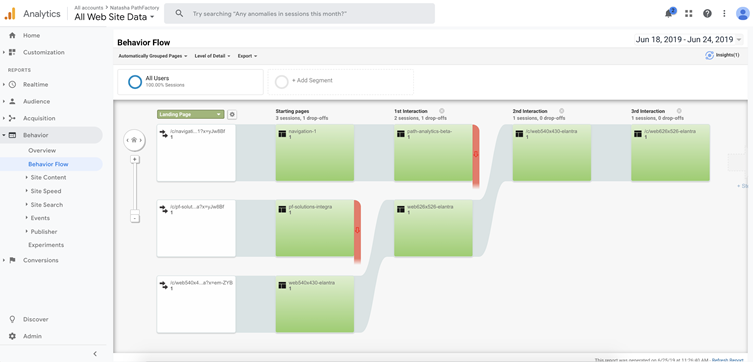
Visitor behavior flow through your content track (visual) – this is a great place to see how far on average viewers get in a track at a very high level. PathFactory’s analytics engine (PathAnalytics) goes deeper showing you average times on assets and other deeper metrics, but this is a nice starting place.
Interesting Notes
- You can choose to deploy the tracking so it counts a page view delivered via PathFactory vs. the page on the site (a blog post for example) as two unique pages or one unique page. Meaning, one page is the blog post as seen as an asset in a track as one page, and the blog post as another page. Or you can see both as a single page together
- PathFactory tracks will display in the Behavior Flow flow charts, and you should see movement through multiple assets as individual interactions
- PathFactory tracks often act as a landing page and you can use the built in Landing Pages reporting exactly as you would with your .com as you will be serving the asset from the canonical url
- UTMs/query strings on PathFactory tracks will act as you expect and reporting based on them will not change
Set-up Option – choose blended or separate properties
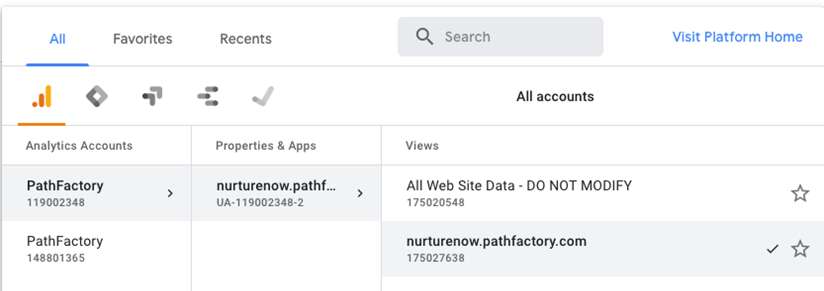
You can choose to report on PathFactory as a separate property/view or blend with main site or both
PathFactory’s Marketing team looks at them separately, treating the website entirely independently from the PathFactory subdomain. Notice the nurturenow.pathfactory.com view vs All Web Site Data view – we feel this makes reporting a bit simpler, but it is up to you!
Views: 99
