For Release K, we continue to expand some of the new Beta features we had introduced with Release J, and added some other new functionality to increase the value of your PathFactory investment.
PathFactory for Revenue Intelligence Beta (PFfRI) is getting more users! PFfRI lets you set up your users to ensure better governance of access and ability to use the new functionality to access Buying Signals and share specific experiences directly to contacts through email messages.
With all of these improvements, what’s new? You’ll see increased granularity for permissions, improved SEO management and increased Microsite analytics, including more date filters, engagement data, and visitor reach.
PFfRI Buying Signals – New Buyers, Most Active, Least Active
We have continued to develop 1st party Buying Signals to provide insights to marketing and sales teams on how to accelerate opportunities and ensure accuracy in communications throughout the buyer journey to increase conversion. Buying signals are the data within the Account pages and provide prescriptive insights on next best action to take for each account, by rep. Using your Salesforce account object and mapping data, we’ll help each rep understand content engagement for each and every account they are assigned.
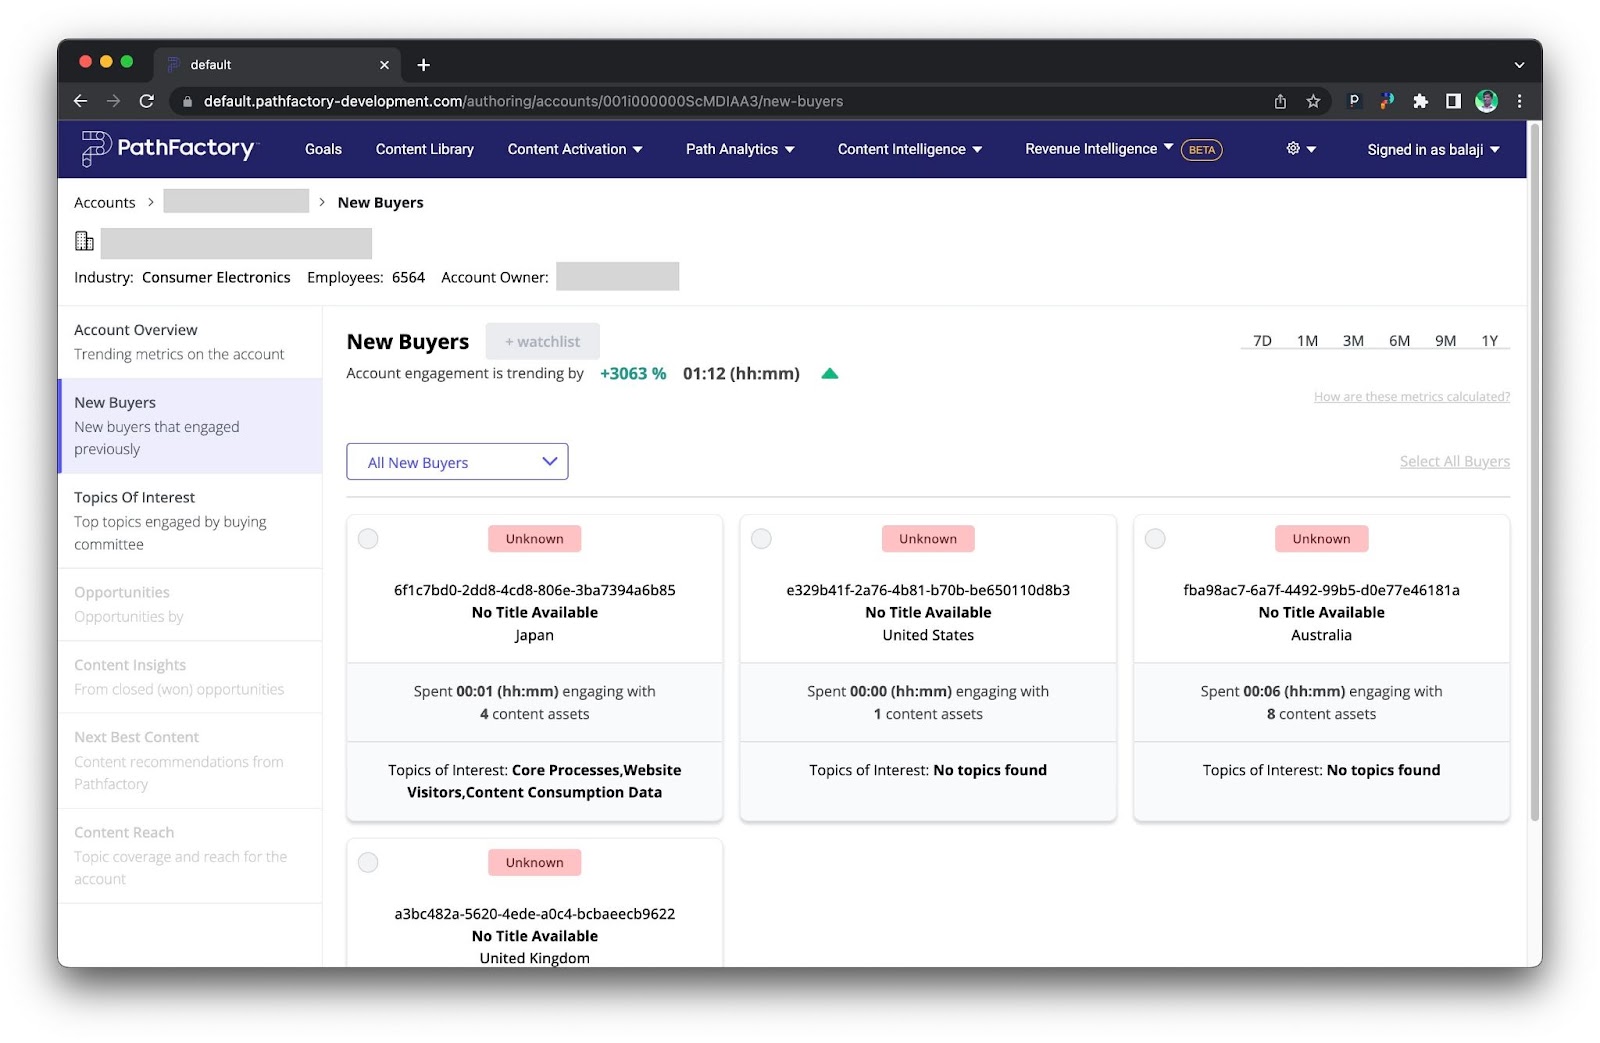
Using this feature, you can see the trending topics across all accounts, including the content topics contributing to the engagement trend. You can see all details of the known and unknown buyers who have been added to the account so you can plan your engagement tasks for them.
Default Period of Analysis: 30 days. The period of analysis does not include the current day (or date in the custom range) of the seller.
Time Spent: Sum of engagement times, across all visitors, across all PF experiences for the period of analysis. This is the primary metrics around which the buying signals are identified and grouped.
New Buyers: New contacts that were created in the period of analysis. Contacts, i.e. buyers, from both the CRM contact table and PF visitor/contact table for the same period are considered. A new buyer may or may not have engagement data.
# of Content: Total number of unique URLs/content assets consumed in the period of analysis.
Delta: difference in the metric value between the current period of analysis and the previous period of analysis of the same duration. Deltas are expressed as a number or % or both in some cases. All tables, by default, are sorted from the highest to lowest delta value. A trend – positive or negative – is determined based on the value of the delta.
Topics: Topics are derived from the content consumed by the visitors/leads/contacts/buyers for that account. Topic names are AI-generated topics that are related to a document. Topics are chosen based on their score associated with a document.
For new buyers present in CRM but not identified in PF contact/visitor table show the name of the campaign which the new buyer engaged. if the campaign data is not present we show no engagement yet.
To begin, select the time period for which you want to see the data. On the top right of the screen, you can see the available parameters.
Note: Trending topics are associated with contents consumed for a set time period.
New Buyers
Here you can see who the new buyers are that have been added to accounts and see their corresponding engagement. This will help increase your buying committee and understand who you need to focus on to drive engagement and plan your next outreach.
Most Active Accounts
These are accounts where time spent ( delta in engagement) >= 0% is considered positively trending accounts. For the accounts that are new or have no previous engagement, for example where the delta is of infinite value or not applicable, the data will not be considered as part of the active list.
The graph shows the total count of metrics for each day of the period of analysis you have selected.

After you have defined the time period you wish to see (top right), you can see the following data.
- Trending topics
- The Most Active
- top 3/4 trending topics at a top level next to the active buying signals charts
- top 3 topics for each account as part of the account list
- Account Summary
- top 3 topics under the popular topics
- top 3 topics consumed by contacts (buyers/visitors) at each opportunity
- New Buyers
- top 3 topics based on the content consumed by each buyer
Least Active Accounts
Here you can see the accounts that are least active and not engaged with your content, so that you can improve the engagement. This section displays the number of accounts that did not engage.
These are accounts for which time spent is less than 0% are considered negatively trending accounts.

To begin, define the time period for which you want to see the account activity. On the top right you can see 7 days, 1 month, 3 months, 6 months, 9 months, and 1 year.
This is the number of days from the date of the query that the account or the buyer has not engaged with a campaign or experience. For example, if the chosen duration is 7 days, then it is the number of accounts that have not engaged with a campaign or PF experience in the last 7 days.
Inactivity
Inactivity is indicated by the total number of accounts that did not engage, for example zero engagement time, with any content during the period of analysis you have selected.
Time Spent
This section displays the Accounts that have dropped in engagement time over the duration of analysis. For example, if 10 accounts have dropped in engagement time by 10 hrs to 20% compared to previous 7 days. The loss is the net drop across the week as compared to the previous 7 days.
If your organization has purchased or signed up for PathFactory for Revenue Intelligence, you may configure this feature. For the default user roles, you see pre-populated access levels under each user role. For custom roles, you may configure the level of access you want to provide for each role. To find out more about custom roles and user roles in general, check out this article in the Nook.
Permissions for PathFactory for Revenue Intelligence & Content Sharing
Note: To use this feature, your organization must have a CRM integration and a license for PathFactory for Revenue Intelligence (PFfRI). If you don’t have this, please contact your Account Executive or Customer Success Manager.
If you subscribe to PathFactory for Revenue Intelligence, you may set specific permissions for users accessing Accounts and Content Sharing within Revenue Intelligence. You can allow view only permission for Accounts and Content Sharing, or leave all of the permissions blank, to prevent that user from all access.

To access this feature:
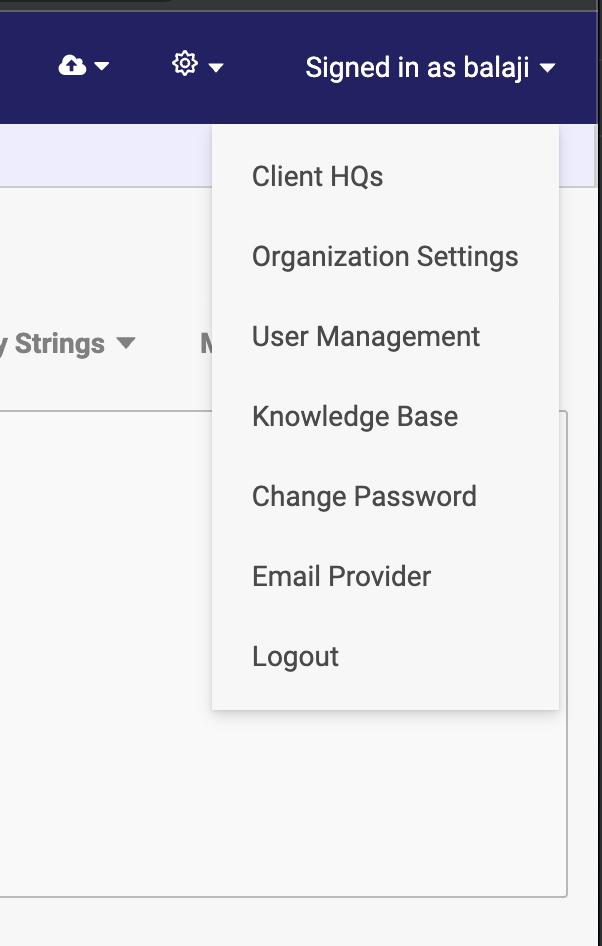
- On the top right of the menu bar, click on your username icon, and then click User Management.
- On the screen that appears, select the User Roles tab.
- Click Revenue Intelligence, and on the Product Permissions tab on the right-side panel, you see Buying Signals.
- Click the right arrow to expand the Buying Signals menu, and there you can see the check boxes for permissions.
- By default, Accounts and Content Sharing are not selected.
- If the user doesn’t have RI permission, there aren’t any options to view Accounts or enable Content Sharing. These options are not accessible.
- Users with this role type have access to the Email Provider menu item in the username drop down, but no other role types see this menu item.
- Only users with this role type applied may see the PathFactory embedded views in Salesforce.
Connect CRM to Salesforce
We have added the functionality for Administrators and Revenue Operations roles to connect their organization’s CRM with Salesforce.
- Navigate to this feature by clicking on your logon name, and then click Organization Settings.
- The following window opens.
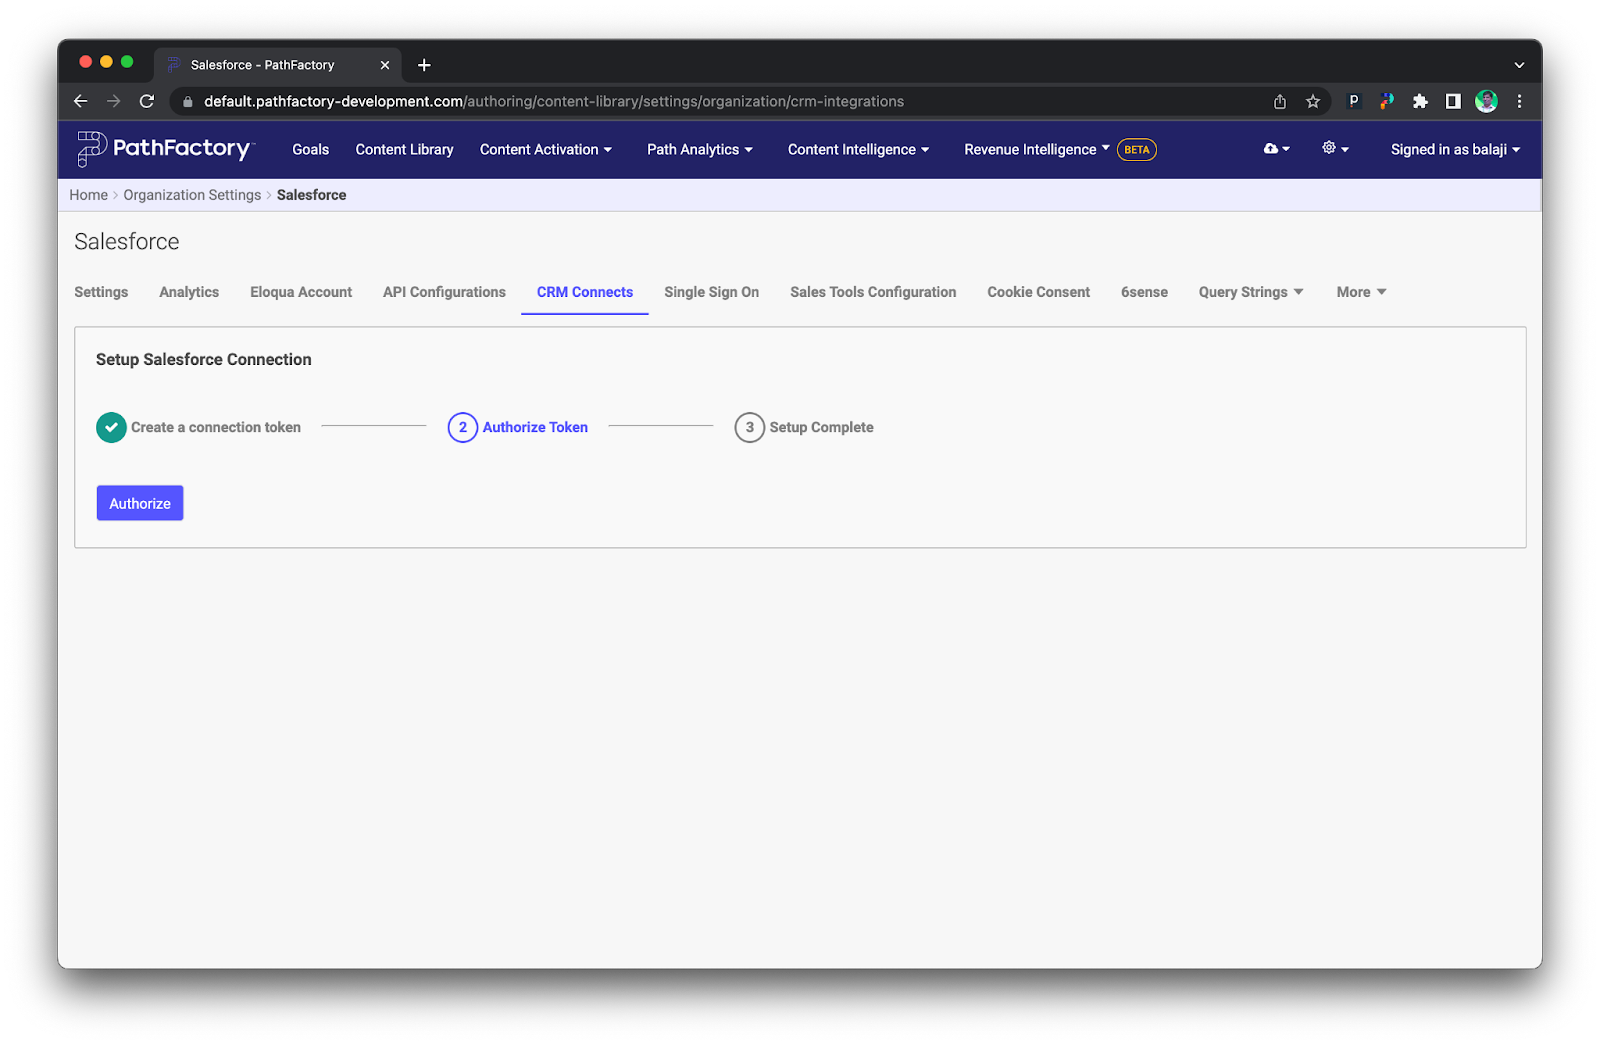
- Click Authorize to enable PathFactory to Authorize Token.
When the process is finished, you see the Setup Complete option highlighted.
New headings for custom and default user roles
Previously, all our role types were in one laundry list. To make it easier to understand which roles are default and which ones have been created custom, we have separated these out under two headings. If you’re an administrator, you will see we have separated roles into the two sections: Default and Custom. To edit these roles, follow these steps.
- Click on your username icon on the top right of your screen. Click on User Management, then select User Roles.
- Here you see Default Roles (Admin, Author, Reporter, and Revenue Enablement) and Custom Roles (roles that you have added) separated out.

Additional permission levels for accessing Templated Experiences and Themes (Available in Beta)
Permission for Templated Experiences
As an administrator, you may set permissions and assign user roles for your users to access Templated Experiences and/or Themes. For the default user roles, the permissions are pre-populated. You may adjust user roles and customized permission levels as follows:
- View
- Create/Edit/Delete
- No Access
By default, the permissions for preset roles are as follows.
- Administrator role has full access to Templated Experiences.
- Author role has View access to Templated Experiences.
- Reporters do not have any access to Templated Experiences enabled (so would receive a 404 error when trying to access the links).
- Custom roles have both the Templated Experiences permissions levels unchecked by default.
Permission for Themes
To edit permissions within Themes, follow these steps.
Note: To edit these settings, you must have an Administrator role assigned to your account.
- On the top right of the main navigation, click on your username icon. From the menu that drops down, click User Management, and then User Roles.
- Select the Platform Settings tab. Within Themes, there are 4 categories of permissions.
- Theme File Editor
- Theme Settings
- Landing Page Templates
- Content Page Templates

Note: If neither View or Create/Edit/Delete checkboxes are checked, the user does not see the Themes or Data Configuration under Platform Settings, or Templated Experience under Content Activation.
Bulk updates for thumbnail images links
Now you can perform bulk updates of thumbnail image URLs for the assets in your content library. Previously, you had to manually update the images one by one. This could be very time-consuming especially if you have hundreds of assets in the content library.
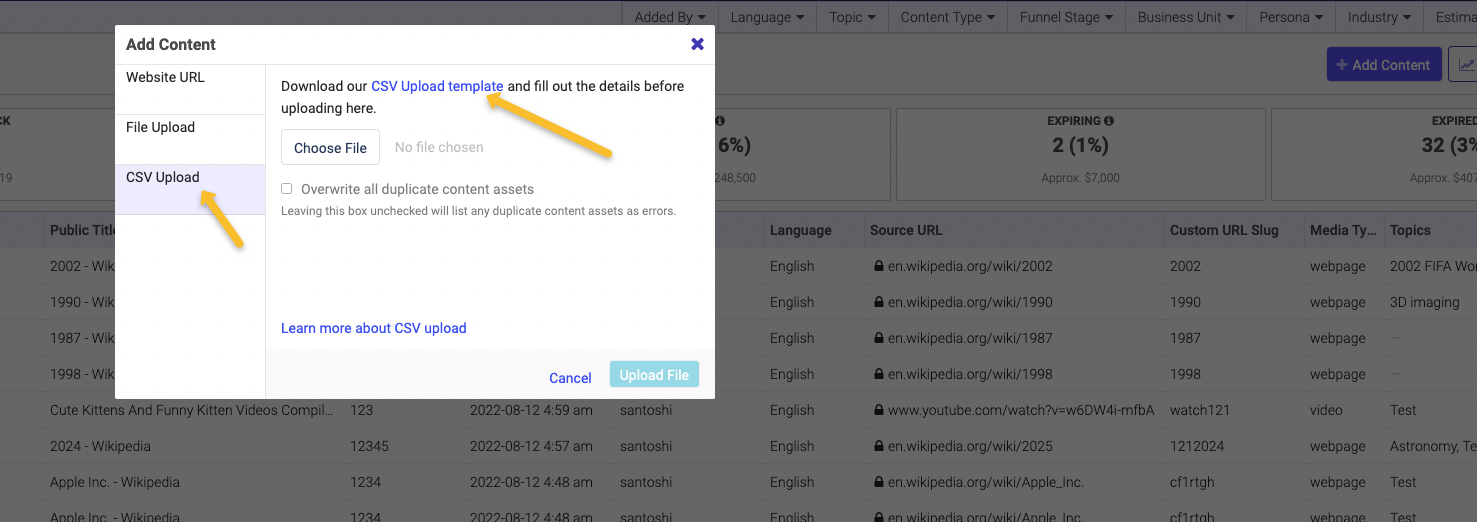
- Go to your Content Library.
- Click +Add Content.
- Click on the link CSV Upload template. The template is automatically downloaded to your computer.
- Double click on the file that was downloaded, and open the file in Excel or File Editor or Numbers.
- Add contents that you want to bulk upload with populated fields you want.
- Save that file in CSV format.
- Go back to the Content library. Click +Add Content, and then click CSV upload. Select the file you edited and then click Upload.
- The file contents are uploaded and you will receive a confirmation email.
Note: If you haven’t inserted a thumbnail image, you can change the thumbnail image at the individual asset level in the content library. Additionally, if you want a preset default image to appear, you would configure this under the Default Image available under Organization Settings -> Settings tab. Please note appearance configuration doesn’t have the functionality to set the default thumbnail image for content.
Bulk updates to the SEO column
As marketers know, Search Engine Optimization (SEO) dramatically increases online visibility. This means that the more people see your website, the more your online traffic increases, and the better your chances to provide your product or service to a greater number of people! With this new release you will notice a new column in the CSV template for adding an SEO title. You can perform a bulk update to the SEO column, and all changes are reflected in the content library. This process simplifies uploading and updating content and is more efficient because you don’t have to manually go into each piece of content in the content library to add its SEO title.
Custom Reports
We have added a new reporting section located under the Path Analytics menu, within Campaign Tools that will house all custom reports.
This feature lets you view all custom analytics (dashboards and reports) that are created for your instance within the application. Under this new section within Path Analytics called Custom Reports, you will be able to view and interact with your custom dashboards and reports just as you would within the standard Path Analytics — including filtering, sorting, downloading, and scheduling as designed. This will empower you with further data access and insight, beyond an emailed snapshot.
Note: To enable this feature for your organization, contact your CSM.


Filter Track Analytics by date
Before release K, you could view analytics on your campaigns for 7, 30, and 60 days. We have added more filters so that you can extend analytics tracking for 90 days and 180 days, inclusive. The results are based on activity within the past 90 days or 180 days. Furthermore, after you have applied a date filter to the analytics, that filter is saved unless you log out of your PathFactory instance or manually change the setting.
- Navigate to Target Tracks by clicking on Content Activation and then on Campaign Tools.
- On the screen that appears, click Target Analytics.

Under the Target Tracks drop-down list (top right) there are two new date filter options.
- 90 days
- 180 days

Additional languages for form fields in Campaign Tools
Previously, when you have created an experience in Campaign Tools that contains a standard form in a language other than English, the form fields remain displayed in English. Now you can translate the standard form field names to provide a unified language within a Target Track, in the language you choose.
To assign a new language to a standard form, first designate the language for a standard form that you plan to use for a content track, and then set the language for the track to match that in the form. Ensure it’s aligned with the expected visitor profile, the content you are planning to serve them and the language they expect to see.
- Click the Gear icon on the top right of the screen. In the menu that appears, select Languages.
- Click the Forms tab.

- On the left side you see a list of available languages. Make your selection and the form fields update accordingly.
- Click Save Forms Settings.
Assign the language within the Target Track by following these steps.
- On the main menu, select Content Activation, then Campaign Tools, and then Target.
- Select a track from the list that appears.
- On the left panel you see the designated language for this track.
- On the left panel, click Language. Select from the list the language you assigned in the standard form. Click Update.
- Click View Form Strategy.
- In the dialog box that appears, ensure you have selected the correct standard form you set up previously.
- Click the X on the top right of the dialog box to close it.
- Next, preview your track to ensure the language is correctly applied.
- As you verify all of the other Campaign Tools for this experience, you will notice all of them, including Target, Recommend, Explore, Microsite Builder and Website Campaigns have the selected language applied.
Designate mandatory tags for new content assets
To ensure enhanced content governance, we have added extra rules to ensure that when you add a new asset to your content library you have all necessary fields completed. Starting in this release, you cannot add a new asset without including all required fields, for example: if in your instance, External ID, Content Type, and Topic are required but the user has left one blank, the associated asset will not be added to the library. This improvement ensures that the right tags are being populated across your content library and lets you get better insights in analytics.
If the user has entered all the required fields, the status for the asset is valid in the database, and the asset appears in the content library. Should the asset not appear in the content library, click Refresh or click X to close the dialog box.
If you have not entered all the required fields, a warning message appears to indicate you haven’t added the asset properly when you click on Done.
If you have clicked X on the dialog box to close the asset or refresh without entering the required fields the asset will not appear in the content library. If you want to add the same asset to the content library, you must re-add the content and ensure all the fields are completed.

Microsites Performance Analytics
We know you have been asking for better reporting on the performance of your microsites so we are adding additional analytics to help evaluate the effectiveness of your microsites. At a glance, you can see metrics for engagement, binge, and performance.
As you know, microsites let you:
- Include more than one content track on a page.
- Tie multiple pages together with navigation.
- Use your own custom code to add page sections and elements.
To access these analytics, complete the following steps.
- Click Content Activation, then Campaign Tools, and then Microsite Builder.
- On the left side of the screen, select a microsite you want to view.
- In the next screen that appears, click the Analytics link. Here you see all of the microsite analytics tabs.
IMPORTANT: To refresh the microsite tabs and data, click Run, located on the top right of the tab.
Microsite Engagement
You can click on this tab to see the metrics related to engagement and binge. This dashboard gets into the value PathFactory brings which provides 1st party buying signals from your audience to showcase true engagement. The Engagement dashboard lets you view the high-level analysis of time spent and binge related to your Microsites. The Engagement dashboard helps you answer:
- How much time did my visitors spend? Is engagement increasing, decreasing, or remaining the same?
- How much was my content binged across all tracks within a microsite?

Microsite Performance
To see a detailed view of your microsite performance, click on the Performance tab related to each landing page. The Performance dashboard helps you evaluate which landing pages, tracks and channels are resonating best with your audience to drive engagement. This can help you plan for future campaigns, while continuing to test different layouts, tracks and channels for different campaign types, these insights can help you drive the most interactions with your buyers to drive engagement. Specifically, the Performance dashboard helps you answer:
- How are landing page(s) performing?
- Which track(s) are yielding the best performance?
- What are the corresponding channels?

Microsite Visitor Engagement
On this tab you can view a high-level analysis of the visitors and impressions, and better understand the reach of your microsites. This can allow you to evaluate the performance of both your landing page and the content tracks behind it. It will easily allow you to understand your reach to both your visitors and the accounts that are engaging with it. This can help you evaluate the performance of your current campaign and how to improve for future campaigns. Specifically, the Visitor Dashboard helps answer the following key questions:
- What is the overall size of my audience?
- How many of my visitors bounced off my landing page vs. made it to a content asset?
- Who are my visitors?
- Which accounts are my visitors coming from?
- How long are my visitors spending on my content?

Legacy Reports
Did you know you can create Scheduled Reports within the Analytics tab and can share with others on your team? When you click on Scheduled Reports within microsites analytics, you can see them in the list.

We continue to add new modules and features, innovating based on customer asks and market demands. If you are interested in Templates and Themes or PathFactory for Revenue Intelligence, reach out to your Account Executive or Customer Success Manager. They are ready, willing and able to introduce you to the key benefits of both and ensure you are getting more from your subscription with PathFactory. And, if you want to actually see the ROI associated with your contract with PathFactory, reach out to your CSM. We’re working on some new analytics that show how we accelerate pipeline, prove out different GTM strategies (e.g. PLG for a specific segment) and ensure your content investments are valid, especially as budgets continue to crunch and markets are slowing and/or softening. We’re here for you and your marketing efforts.
Views: 134