The PathFactory Overview provides a centralized view of aggregated engagement across all experiences, helping marketers uncover trends and performance insights at scale.
With robust filtering capabilities, users can explore how content is performing by campaign, industry, form conversions, and more. The Overview tab includes purpose-built dashboards that surface insights across key areas:
- Overview – high-level performance summary
- Campaigns – engagement by campaign and UTM performance
- Content – asset-level insights across all experiences
- Visitors – behavioral trends across known and unknown users
- Accounts – account-level engagement and buying signals
- Trends – macro-level views into engagement changes over time
Together, these analytics views provide powerful visibility into what’s working, where to optimize, and how content is influencing pipeline activity.
This article provides an overview of the new analytics views available on the PathFactory Overview, and will guide you through the various tabs and views available to support your marketing planning, execution and insights.
PathFactory Overview Navigation
At the top of the PathFactory Overview, you’ll notice six tabs that offer distinct and essential insights that cater to different aspects of your marketing strategy:
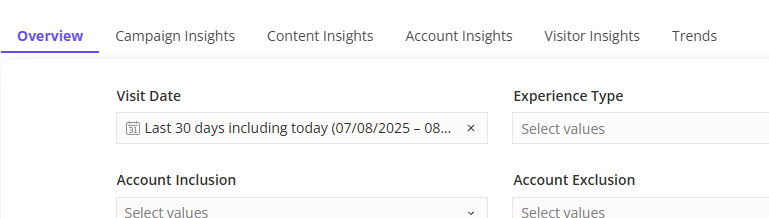
Filters
The Overview section of the analytics platform has the most robust filtering capabilities, maintained through each categorical tab for consistency:
| Filter Name | Function | Usage |
|---|---|---|
| Visit Date | Filters visits by date range | Choose predefined or custom date ranges. Every other filter is responsive to the data made available by the reporting timeframe |
| Experience Type | Filters by type of PathFactory experience | Overview Analytics includes all PathFactory experiences. You can use this filter to isolate experience types (i.e. Templated Experiences only) |
| Experience Name | Filters by specific experience name | Choose one or more experiences (ex. group and report on all experiences with ABM in the experience name) |
| Query String (Page View Level) | Filters based on query string values in URL | Segment data by standard UTM parameters, custom parameters or anything else appended to a URL during visitor clickthrough NOTE: this filter remembers input, but operator defaults to “contains” when switching tabs |
| Account Inclusion | Shows only data from selected accounts | Enter/select account names to isolate |
| Account Exclusion | Removes data from selected accounts | Enter/select account names to exclude |
| Visitor Status | Filters visitors by status | Segment any report by Known vs Unknown visitor status |
| Visitor | Filters by specific visitor identity | Select visitors to isolate |
| Landing Page / Content Title | Filters by viewed content title | Select content or landing page to isolate engagement and interaction metrics |
| Country | Filters by visitor’s country | Select one or more countries (based on reverse IP data / intent provider data) |
| Industry | Filters by visitor’s industry | Select one or more industries (based on reverse IP data / intent provider data) |
| Device Type | Filters by type of device used | Options like Desktop, Mobile, Tablet |
| Folder Inclusion | Filters to include experiences within specified folders | Dropdown will only show folders with engagement within selected timeframe. Select parents and children independently |
| Folder Exclusion | Filters to exclude experiences within specified folders | Dropdown will only show folders with engagement within selected timeframe. Select parents and children independently |
| Visitor Exclusions | Excludes predefined visitor types | This is tied to the organization level exclusions for keeping data clean (ex. removing internal testing user data) |
| Bot Exclusion | Removes bot traffic | Automatic filtering of bot and suspicious proxy traffic |
| Exclude 0s Duration | Removes zero-second sessions | Behavioral exclusion for visitors who were not flagged as bots, but left before content was loaded |
Overview Tab
The Overview tab provides additional content engagement metrics that can help marketers understand and improve the performance of campaigns and content. Key metrics you can find on this tab include:
- Total visitors
- Bounce rate
- Returning visitors
- Known vs. Unknown engagement trend line view
- Ratio view of new vs. total visitors chart
- Total Accounts
- New Accounts
- New vs. returning account engagement comparison chart
Scroll down further to see additional engagement metrics:
- Engaged sessions
- Total sessions
- Total session duration
- Engagement rate
- Average session duration trend line view
- Content views chart broken down by known/unknown engagement
At the bottom of this screen, you’ll also find form capture metrics and charts showing top-performing content and topics based on engagement time thresholds.

Campaign Insights Tab
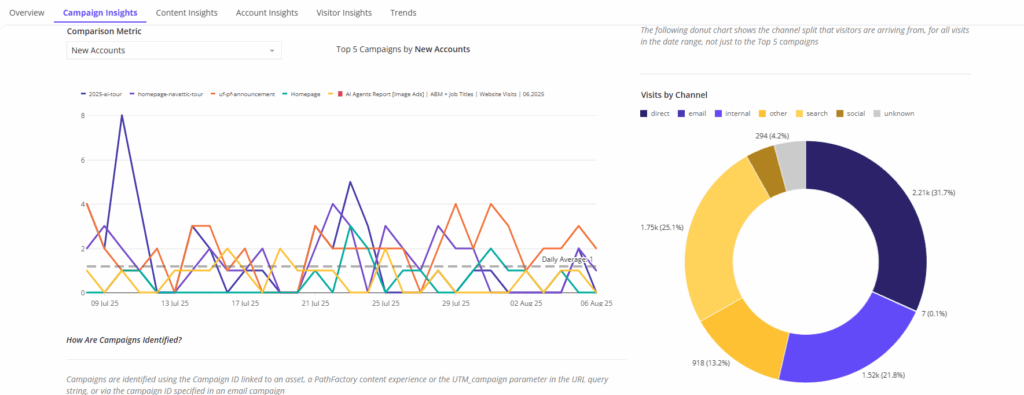
The Campaigns tab gives marketers a comprehensive view of campaign performance across all PathFactory experiences, helping teams understand which campaigns are driving engagement, conversions, and account activity.
Key Capabilities Include:
- Campaign Attribution: Identify how visitors are entering your experiences by campaign, medium, and source (based on UTM parameters).
- New Accounts Tracking: See which campaigns are contributing to net-new account engagement over time.
- Visits by Channel: Visual breakdown of traffic sources (e.g., direct, search, social, internal, email).
- Campaign Conversions: Highlights the top campaigns generating form fills and other conversion events.
- Top Campaign Experiences: View the most engaging content experiences within each campaign, based on time spent.
- Drill-Down Tables: Explore campaign performance by UTM parameters with detailed metrics like:
- Number of visitors and accounts
- Bounce rate
- Known vs. unknown visitor breakdown
- Visitor types and behavior
The Campaigns tab helps marketers assess which efforts are most effective, optimize channel mix, and prove impact across the funnel.
Content Insights Tab
The Content tab gives marketers a clear view into how each content asset in their PathFactory library is performing. It surfaces insights on content consumption by both known and unknown visitors, highlighting which assets are most effective at driving engagement across experiences.
Key Capabilities Include:
-
Engagement Concentration Summary: Instantly see how much of your engagement is driven by your top-performing assets (e.g. “43 content assets driving 80% of engagement”).
-
Known vs. Unknown Views: Compare how content performs across different audience types and identify assets that are resonating with known prospects.
-
Top Content Assets: Ranked by total views, broken down by audience type, average view time, and engagement score.
-
Content Performance Table: View key performance metrics by individual content asset:
-
Total Views, Avg. View Time, Engagement Score
-
Bounce Rate, View Duration Change (%), Experiences the asset appears in
-
-
Content Type Roll-Up: Analyze performance across broader content categories (e.g. reports, videos, landing pages) to understand which formats perform best.
-
Optimization Insight: Use performance and view trends to identify which assets should be promoted, refined, or archived.
This tab is designed to help marketers understand content effectiveness, inform strategy, and optimize their library for deeper engagement and conversion.

Visitor Insights Tab
The Visitor Insights tab provides a comprehensive view of how both known and unknown visitors are engaging with your PathFactory experiences. It highlights key behavioral trends across your audience and allows you to explore performance at both the aggregate and individual visitor levels.
Key Metrics Include:
-
Total Visitors (new vs. returning)
-
Known vs. Unknown Visitors
-
Sessions and View Time (total and per visitor)
-
Visitor Binge Rate (deep engagement patterns)
-
Visitors Who Met Threshold (based on your engagement criteria)
-
Multiple Session Percentage (repeat engagement)
Additional Insights:
-
Content Consumption Patterns: View which content types (e.g. blog posts, case studies, videos) are generating the most engagement.
-
Channel Attribution: See which traffic sources (direct, search, social, internal, etc.) are driving the most sessions.
-
Visitor Table: Drill into detailed session-level data for individual visitors, including engagement scores, session duration, threshold met, and known visitor status.
This tab helps marketers identify high-value prospects, understand how visitors are progressing through content, and prioritize outreach based on behavioral signals.

Account Insights Tab
The Account tab provides a detailed view of how organizations are engaging with your PathFactory content and experiences. It enables both marketing and sales teams to identify high-value accounts, prioritize outreach, and track buyer behavior at the account level.
Key Capabilities Include:
-
Account Tiering by Engagement Score: Accounts are automatically categorized into four tiers—Low, Moderate, High, and Priority—based on relative engagement performance.
-
Industry & Geography Breakdown: Visualize which industries and countries your engaged accounts belong to, helping guide vertical strategies and regional campaigns.
-
Account-Level Engagement Trends: Access granular data per account, including:
-
Number of Visitors
-
Total Asset Views (Known & Unknown)
-
View Time and Bounce Rate
-
Engagement Score Trends
-
Number of Engaged Sessions (Known & Unknown)
-
Use Cases:
-
Prioritize in-market accounts with high engagement
-
Surface silent intent signals from unknown visitors
-
Align marketing with sales on target accounts and active opportunities
-
Validate account-based campaign performance
The Account tab serves as the bridge between content engagement and account intelligence—giving you actionable insight to fuel ABM strategies and outbound efforts.
Conversion Insights Tab
The Conversion Insights tab provides a clear view of how engagement across your digital experiences translates into meaningful conversion events such as form fills, CTA clicks, and content downloads. It surfaces not just where conversions happen, but which experiences, content assets, and accounts are driving them — helping teams better attribute marketing impact and optimize conversion strategy.
Key Capabilities Include:
- Conversion Performance Summary:
Quickly assess overall conversion activity across all experiences. Understand total conversion volume, performance trends over time, and shifts in form fills, CTA clicks, and downloads. - Top Converting Accounts:
Identify the accounts driving the most conversions to prioritize follow-up and align sales and marketing efforts on high-intent opportunities. - Conversion Event Detail:
Drill into granular conversion data, including account name, visitor identity (when available), associated content or experience, and timestamp — giving full context into the buyer journey at the moment of conversion. - Form Performance Analysis:
Evaluate how individual forms and form placements are performing. Conversion rates and impression-to-fill metrics help pinpoint the most effective conversion mechanisms. - Content and Experience Attribution:
Understand which landing pages, content assets, and experience types are contributing most to conversions, helping refine campaign and content strategies.
Use Cases:
-
Identify and prioritize high-intent accounts based on conversion activity
-
Optimize form placements, CTA strategies, and content assets to boost conversion rates
-
Align marketing and sales teams around conversion-ready accounts and leads
-
Measure and attribute conversion performance to specific experiences and assets
The Conversion Insights tab acts as the bridge between engagement and pipeline, turning interaction data into clear signals of buyer intent and marketing impact.
Trends Tab
The Trends tab provides a long-term view of engagement patterns, audience behavior, and content performance. Unlike other tabs, the default reporting window here is 12 months, giving marketers a broader perspective on how engagement is evolving over time.
Key Capabilities Include:
-
Visitor Metrics Over Time
Track total, known, and returning visitors by month, helping identify retention trends and shifts in known user identification. -
Session & Engagement Trends
Visualize monthly changes in total sessions, binge rates, average session time, and session depth. -
Form Captures & CTA Activity
Monitor how conversion behavior (e.g. form submissions, CTA clicks) fluctuates over time and correlates with visitor activity. -
Content Engagement Patterns
Analyze incremental asset views and view time beyond the first content piece—showing how deep visitors go and how long they stay. -
Account Volume Trends
Track the number of engaged accounts monthly and the percentage of visitors reaching a meaningful engagement threshold (e.g. score ≥ 3). -
Experience Creation Activity
See how many Target, Recommend, Content Playlists, Microsites, and other experiences are created each month to support demand gen and personalization efforts.
Use Cases:
-
Understand seasonal engagement patterns
-
Identify months with peak performance or drop-off
-
Correlate visitor behavior with campaign efforts or content launches
-
Monitor effectiveness of ongoing personalization strategies

How to Export Data From PathFactory Overview Analytics Dashboards
You can export analytics data reports in the following ways:
-
- Email– export data reports and send them to an unlimited number of email recipients, ensuring that your team members or stakeholders receive the information directly in their inboxes.
-
- Download the data as a file – save data reports directly to your computer in various formats, such as CSV or PDF and more, for easy access, offline analysis, and sharing.
-
- Send to cloud storage – configure the export to send data reports to cloud storage services like Google Drive or AWS S3, ensuring that your data is securely stored and accessible from anywhere.
-
- Send via Webhook – configure webhooks to automatically send data reports to specific URLs or endpoints in real-time. This allows seamless integration with other systems like CRM platforms or other marketing tools, ensuring immediate data transfer and enabling real-time processing and automated workflows.
Note: Clicking on the 3 dots within any element (visual / table) allows you to see the export / scheduling functions.

To see step-by-step instructions on data report export options and scheduling data exports, read How to Download and Share Analytic Reports, a section in the article, Creating, Analyzing & Sharing Data Reports.
Views: 570