What are Analytics in PathFactory?
PathFactory Analytics provides a clear, data-driven view of how your marketing programs are performing.
You can measure and analyze channels, experiences, content, accounts, and visitors to uncover what’s working, where audiences are engaging most, and what actions are driving meaningful outcomes.
These outcomes can include both revenue-related milestones (opportunity creation, pipeline progression, deal closure) and non-revenue events (visitor deanonymization, form submissions, CTA clicks, and other self-identifying actions). By combining these perspectives, you get a complete picture of performance and impact.
|
Note
|
Do you want to use your PathFactory in external platforms too? Read about the integrations we support here. |
How Do Analytics Work?
PathFactory Analytics operate in three core stages:
1. Collect
Our platform tracks engagement across all connected channels, experiences, and assets. This includes activity from both known and unknown visitors, ensuring you have the fullest possible dataset to work with.
2. View
Your analytics update continuously as new activity is recorded.
From the perspective of precision, PathFactory aids with bot identification and prioritizes showing you accurate data, equipping you with tools to further narrow down and refine results as needed.
3. Extract and Act
Analytics aren’t just for viewing — they’re built for action. You can:
-
Download reports in CSV or PDF format
-
Schedule reports for delivery via email
-
Export to cloud storage destinations for ongoing workflows
This flexibility lets you integrate PathFactory data directly into your reporting processes and decision-making cycles.
Active vs. Passive Engagement
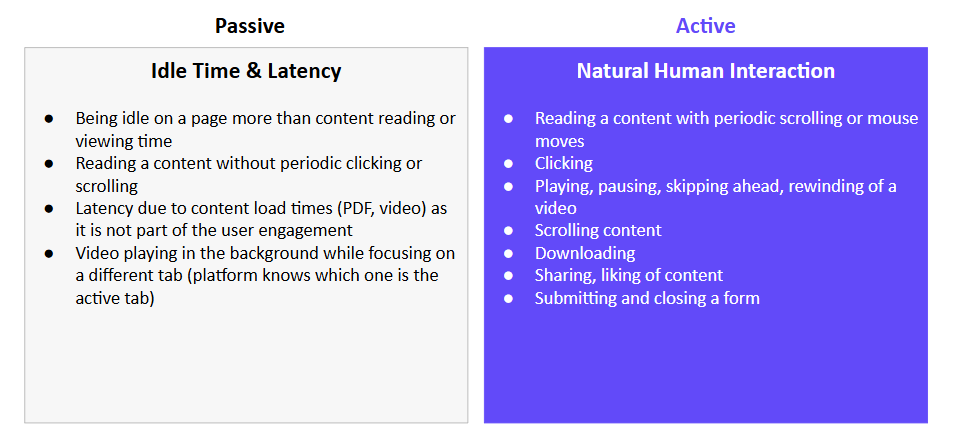
How PathFactory tracking distinguishes the engagement data it collects from the perspective of ‘active’ and ‘passive’ engagement:
-
Active Engagement: Direct, measurable interaction — scrolling, clicking, filling forms, or other activities showing active attention.
-
Passive Engagement: Content is open but no direct activity is detected, such as leaving a page open in a background tab.
This distinction helps you better understand true audience attention versus background exposure.
Why It Matters
With PathFactory Analytics, you can:
-
Identify your highest-performing channels and experiences
-
Pinpoint content that drives the most engagement
-
Understand account-level trends for both known and anonymous visitors
-
See how visitors move from first touch to impactful events
-
Use this intelligence to guide campaign optimization, content strategy, and sales enablement
The result: actionable insights you can trust, delivered in a way that empowers your team to focus on what drives performance.
The following are the different levels of analytics, and the types of questions they can help answer:
-
Experience Level: Data collected from a single content experience
-
How is a specific experience performing? How many visitors have engaged with it? How much content did they consume within the experience? What’s the average session duration?
-
-
Aggregate Level: Data collected across multiple experiences
-
How are all of your experiences performing across the platform? How many total visitor interactions have occurred? Which experiences are driving the most engagement or conversions? What trends emerge across all experience activity?
-
-
Granular Level (Content, Visitor, Account, PFRI): Data correlated across multiple dimensions
-
Content View: Which individual assets are performing best? What types of content are most effective at different funnel stages?
-
Visitor View: How is a specific visitor engaging across experiences? What’s their journey, session frequency, and depth of engagement?
-
Account View: Which accounts are showing the strongest engagement? Are they in-market, and how does their activity correlate with open opportunities?
-
PFRI View: How does engagement align with pipeline and revenue? Which experiences and accounts are contributing to opportunity creation, progression, or closed-won deals?
-
Navigation: where to go for what
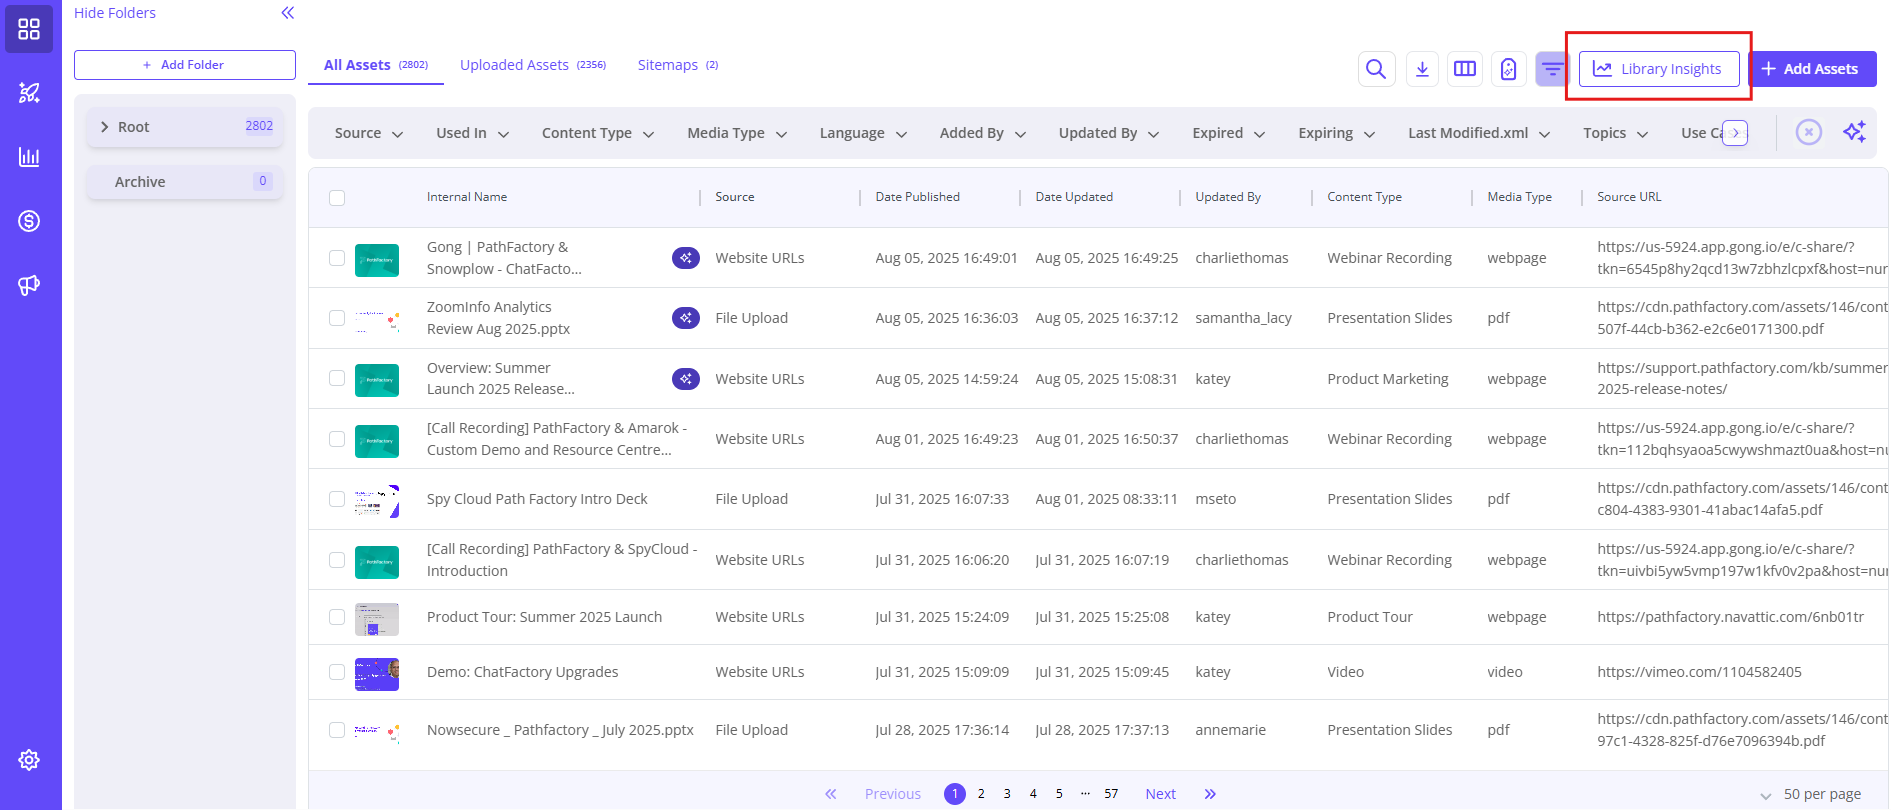
Content Library tab:
Persona: Content Marketers
Functionality: See library composition, content usage, content and experience audit (all attributes, engagement metrics).
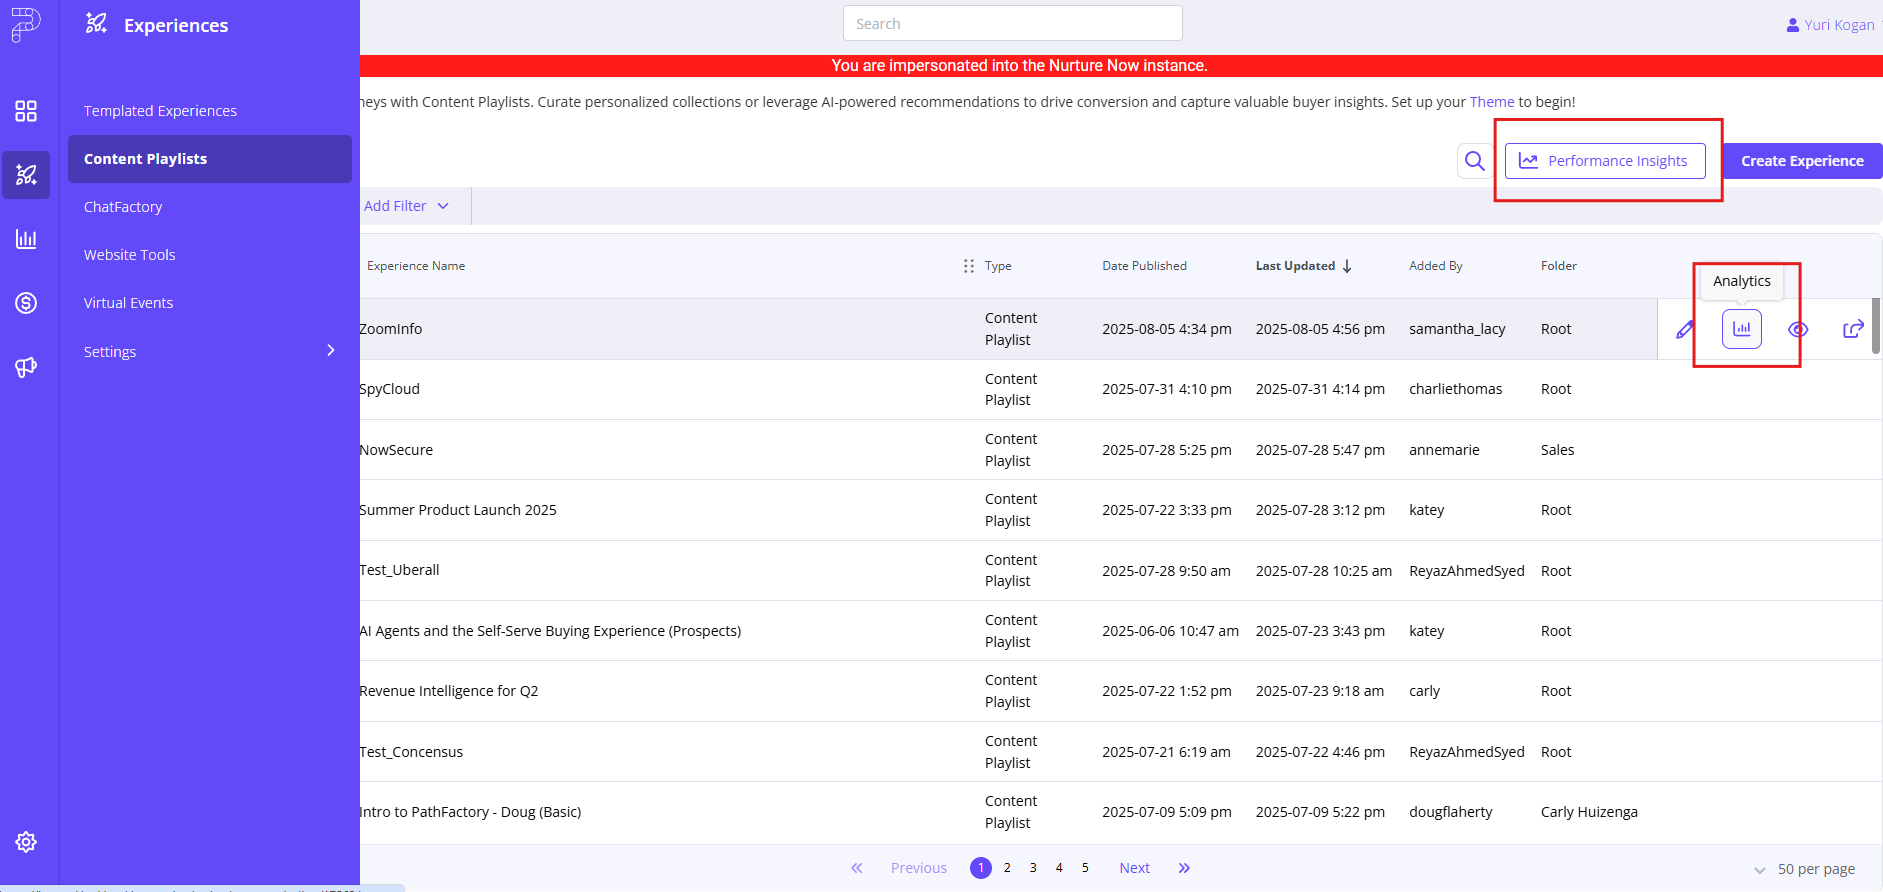
Experiences tab:
Persona: Marketers
Functionality: See performance of your experiences, details on visitors, forms and UTM parameters. You can click on an individual experience to see all analytics related OR the “Performance Insights” button to see aggregated performance (multiple experiences)
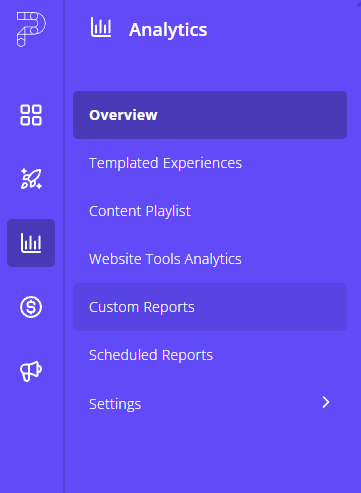
Analytics Tab:
Persona: Marketers, Content Creators
Functionality: The Analytics tab offers unique reporting sections and short-cut links to aggregated reporting areas.
- Overview: Aggregates all tools to allow high level reporting and granular exploration. This section offers an Overview of all key metrics in the first tab. Campaigns, Content, Visitor & Account dedicated views and a complimentary “Trends” tab with visualizations for longer time periods. This reporting section has the most robust filtering / segmentation set, enabling an extended depth of data exploration & export.
- NOTE: The overview also includes Legacy Tool analytics (Tracks, Microsites, Explore Pages)
- Templated Experiences / Content Playlist / Website Tools Analytics: These are short-cuts to the “aggregated” views for the respective tools.
- Custom Reports / Scheduled Reports: When the PathFactory team creates a custom report for individualized reporting needs, they can be found in the Custom Report section. Scheduled reports can be managed in the “Scheduled Report” section.
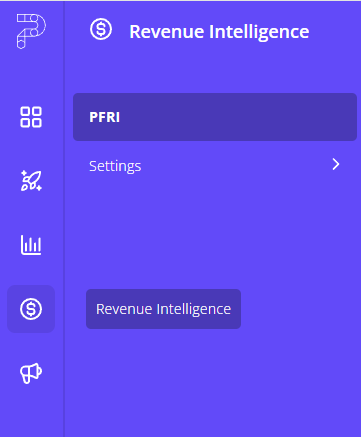
Revenue Intelligence Tab:
Persona: Marketers, BDR/Sales
Functionality: The Revenue Intelligence tab provides powerful, role-based reporting that merges engagement data with CRM and intent signals. Users can explore account-level insights, track buyer journey activity, and uncover which content and experiences are contributing to pipeline creation, progression, and revenue.
Other Resources
Views: 119
