This article provides an overview of how to access and use the revenue intelligence dashboards and data available to marketers and sellers in PathFactory for Revenue Intelligence (PFRI).
If you are a marketer, you can access PFRI dashboards through the PathFactory main navigation menu. If you are a seller, you can use these same dashboards from directly within your PFRI access in Salesforce.
PFRI Accounts Dashboard
The Accounts Dashboard shows data tracking engagement levels in your CRM accounts, helping you identify high-performing accounts and uncover opportunities for further outreach or upselling. By analyzing this data, you can prioritize resources and focus on the accounts most likely to drive revenue growth.
To access the Accounts Dashboard view, select Revenue Intelligence from the main PathFactory navigation menu.

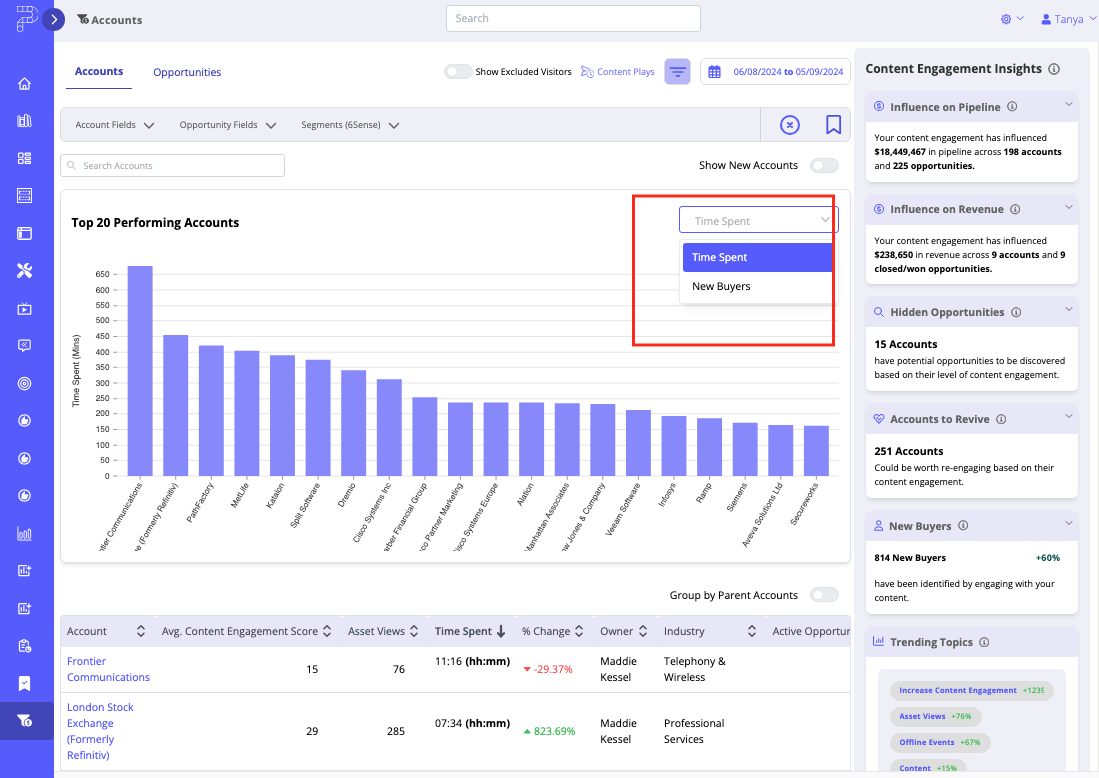
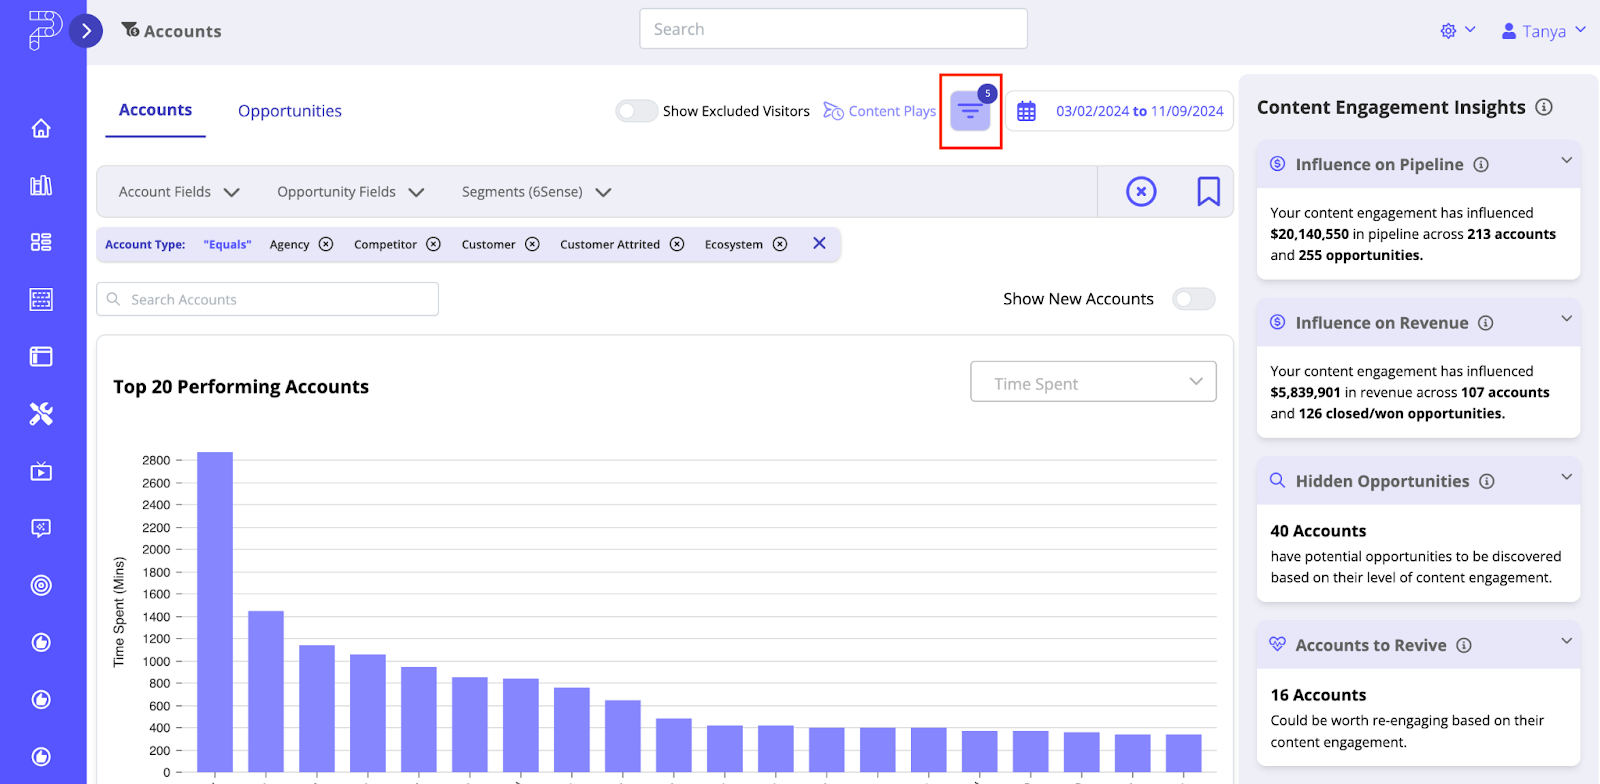
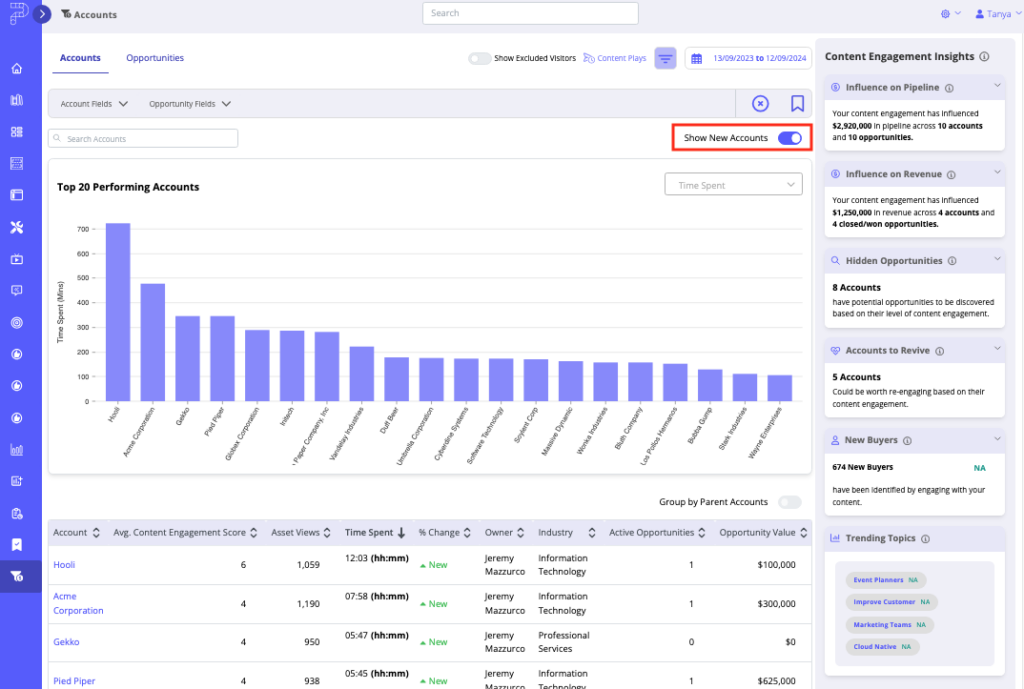
You can see here your top 20 most engaged accounts by Time Spent or Number of New Buyers by using the dropdown menu highlighted in the screen capture below.
Below the chart, you’ll find a table view listing all your CRM accounts along with their detailed engagement activity within PathFactory Experiences. You can sort any column in the table to customize your views.
Filtering options allow you to customize your data view, add filters, save filter sets for future use, and quickly toggle between different insights. The Filter bar is highlighted in the screen capture below.
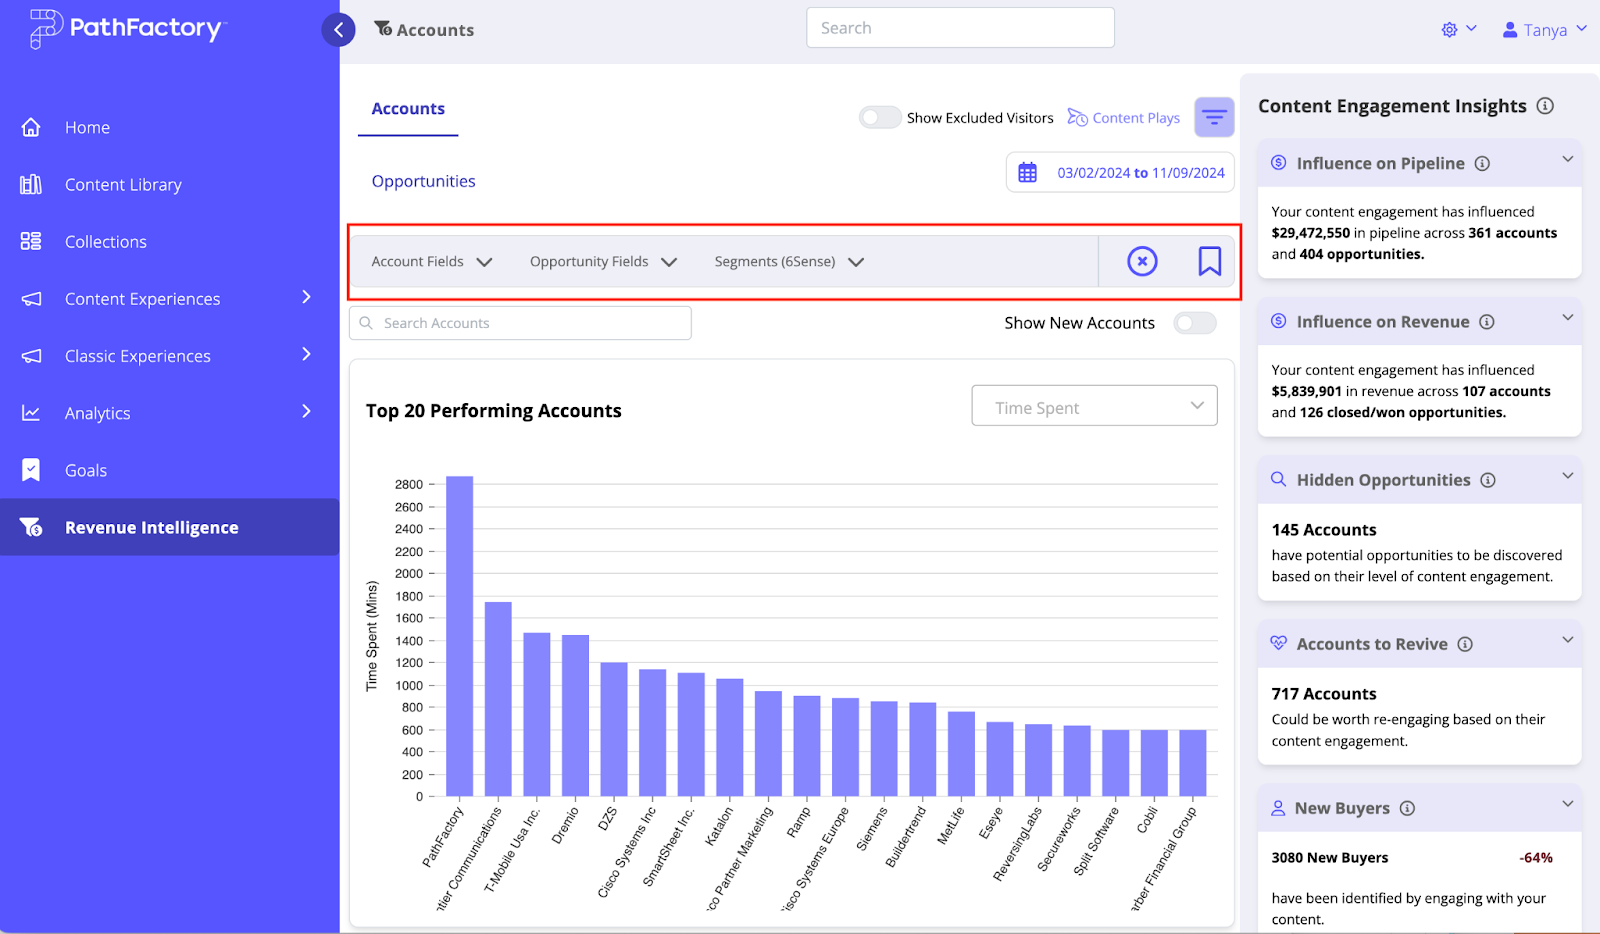
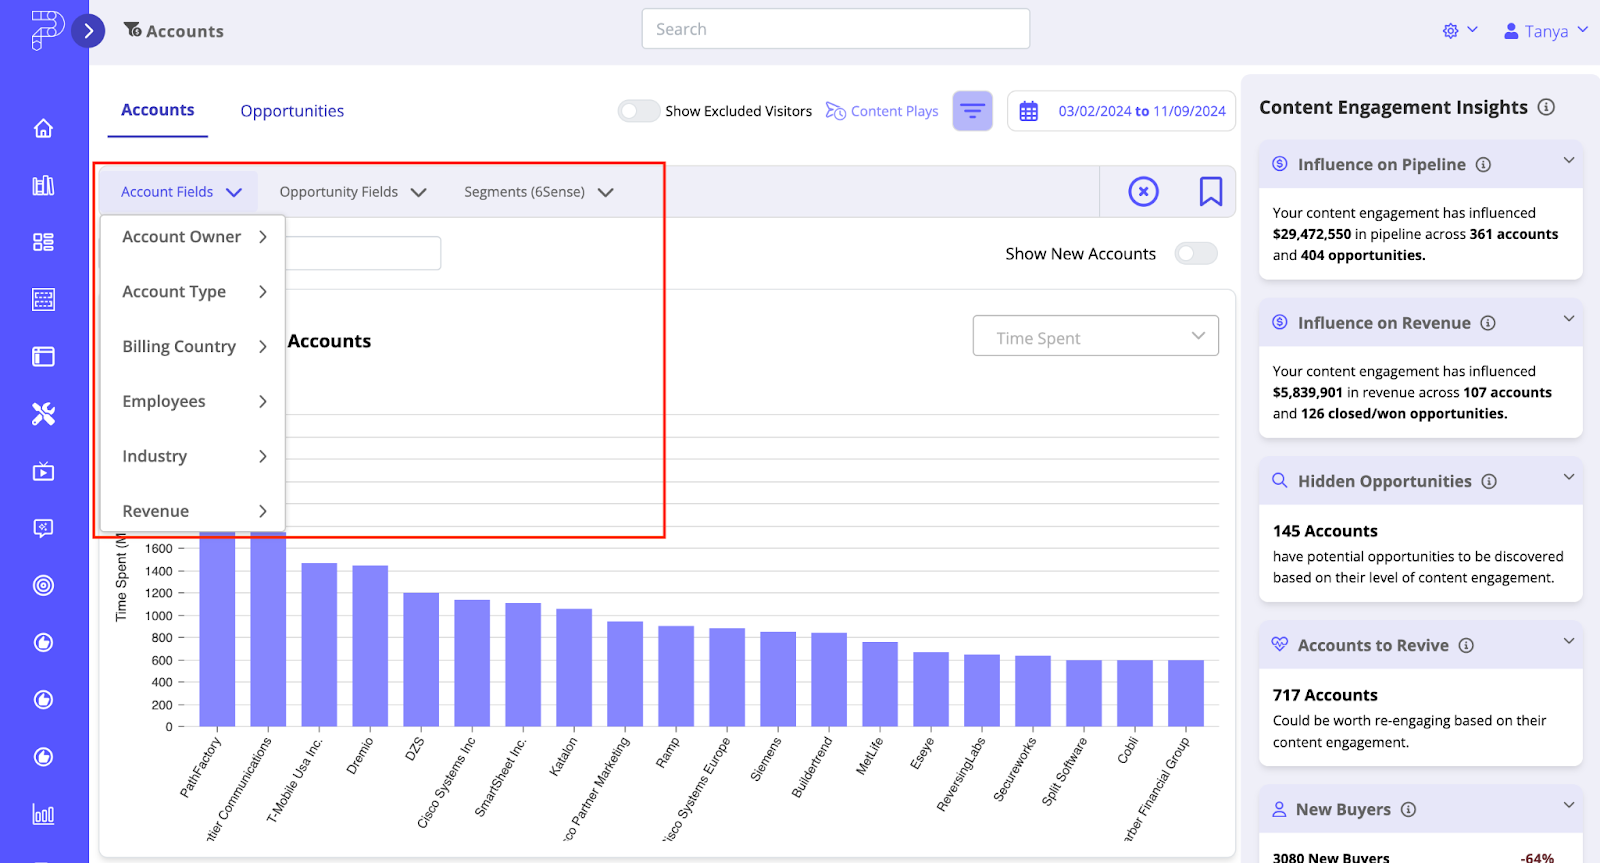
- Apply Filters: Use the dropdown menus in the filter bar to apply filters for Accounts, Opportunities, or Segments.
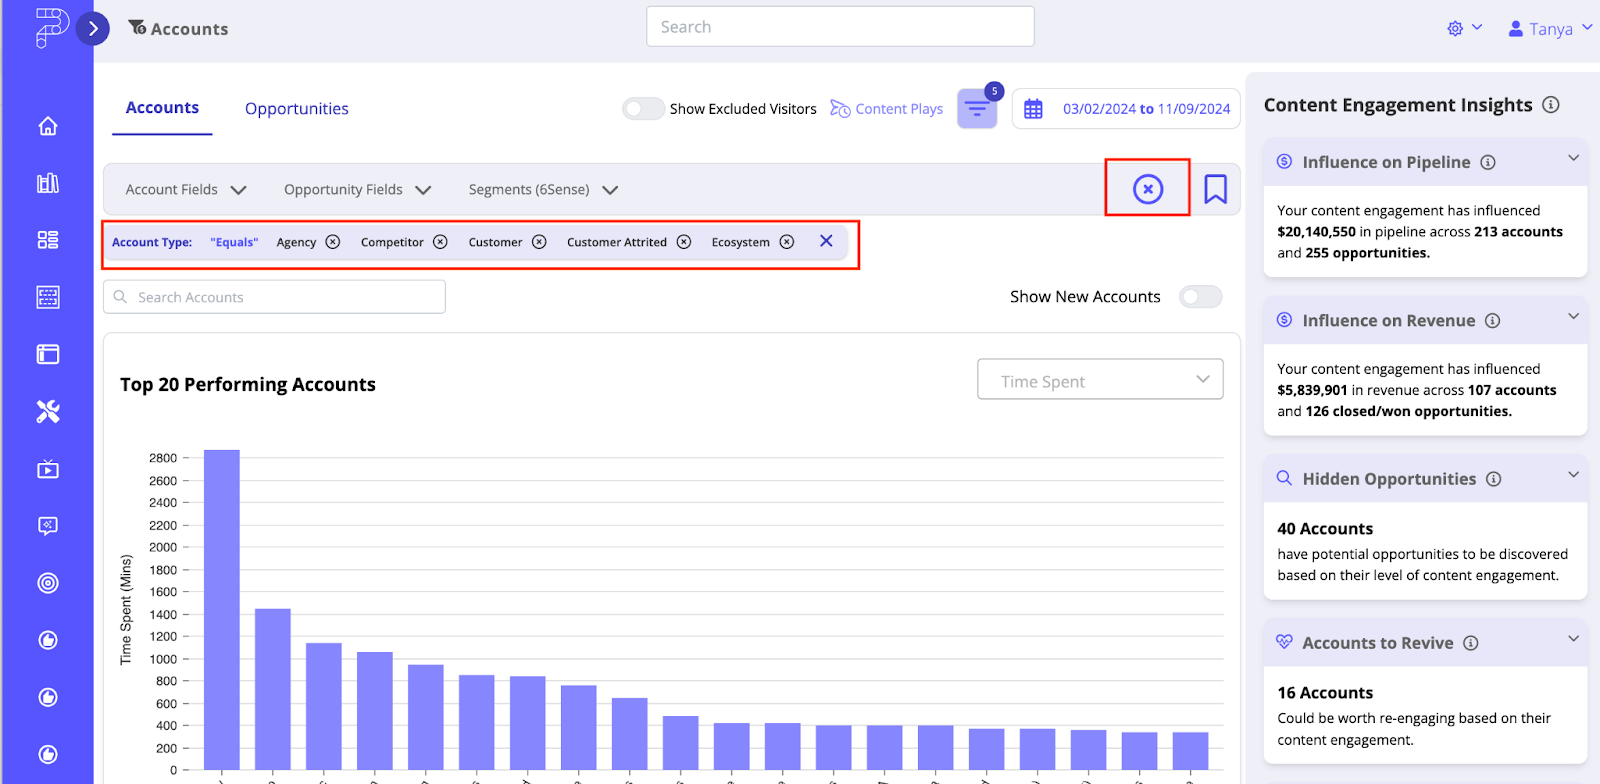
- Remove Filters: To remove filters that are currently applied to the given data set, click the X next to the filter. To remove all currently applied filters, click the X in the Filter bar.
- View Saved Filters: To view your saved filters, click the ribbon icon in the Filter Bar. This displays a dropdown list of all your saved filter sets.
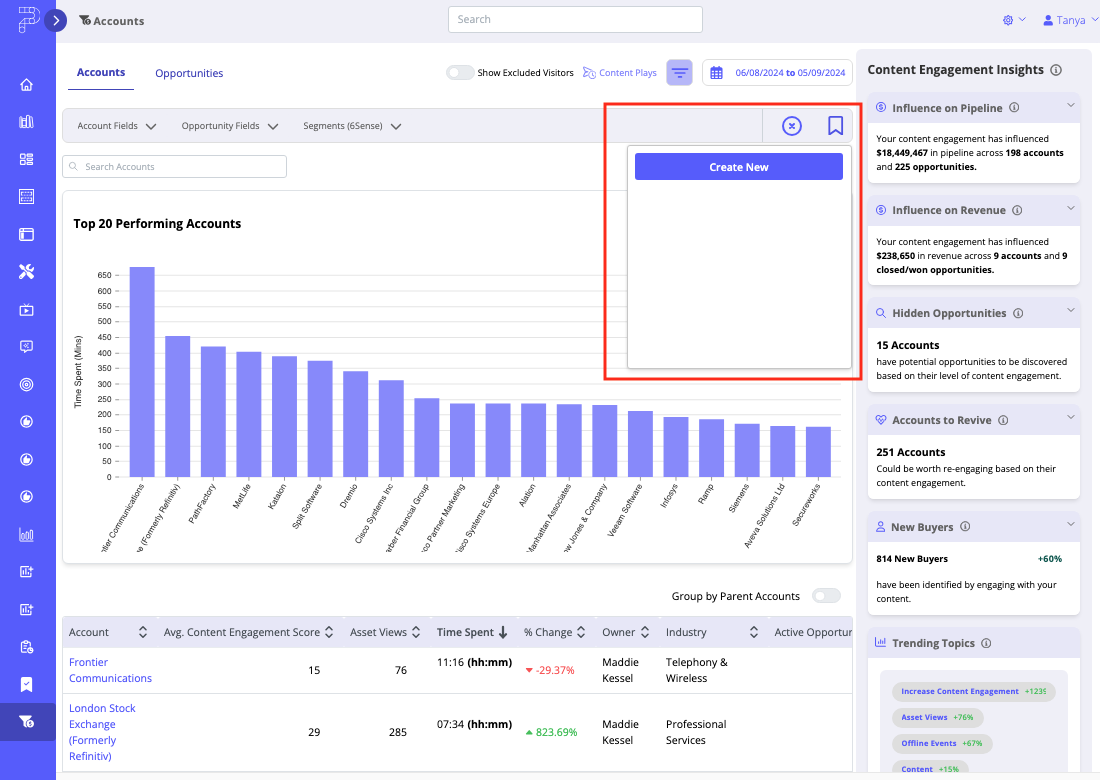
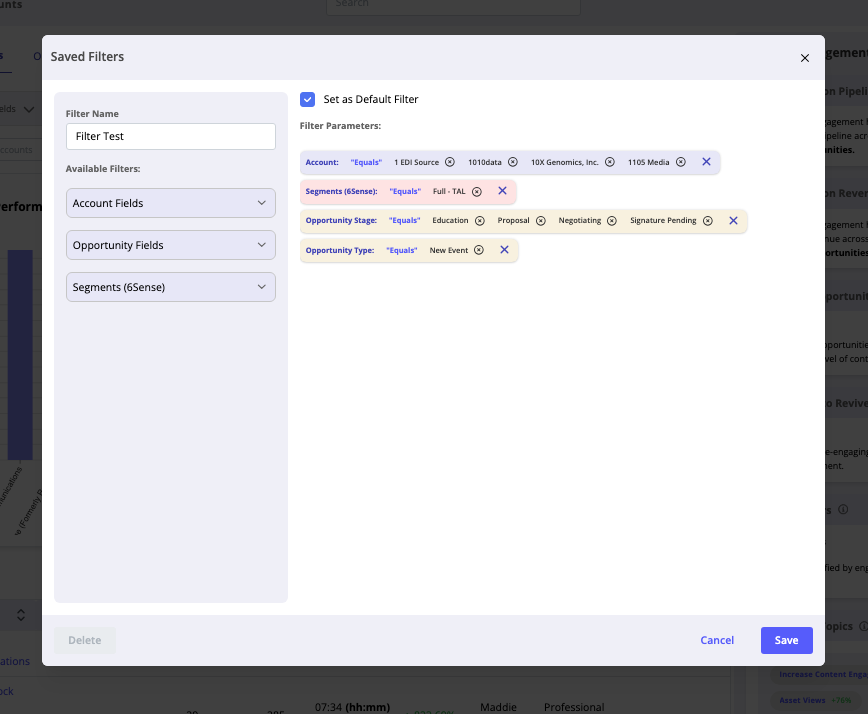
- Create New Filter Sets: To create a new filter set, click the ribbon icon to open the saved filter menu and then click Create New. A popup will appear where you can configure your filters, like Time Spent or Engagement Level. Once you’re done, click Save to store the settings for future use.
- Hide/Show Filters: Use the Hide/Show Filters button to toggle the visibility of the filter bar, allowing you to streamline your workspace and focus on the data at hand. You’ll notice the button displays the number of filters that are currently applied to the data.
- Account Owner Filter: When you select this filter, you’ll see all of the accounts to which you were assigned as the owner in Salesforce. If you hold an individual owner role in Salesforce, you won’t have the option to remove this filter, to ensure you see data relevant to your assigned accounts.
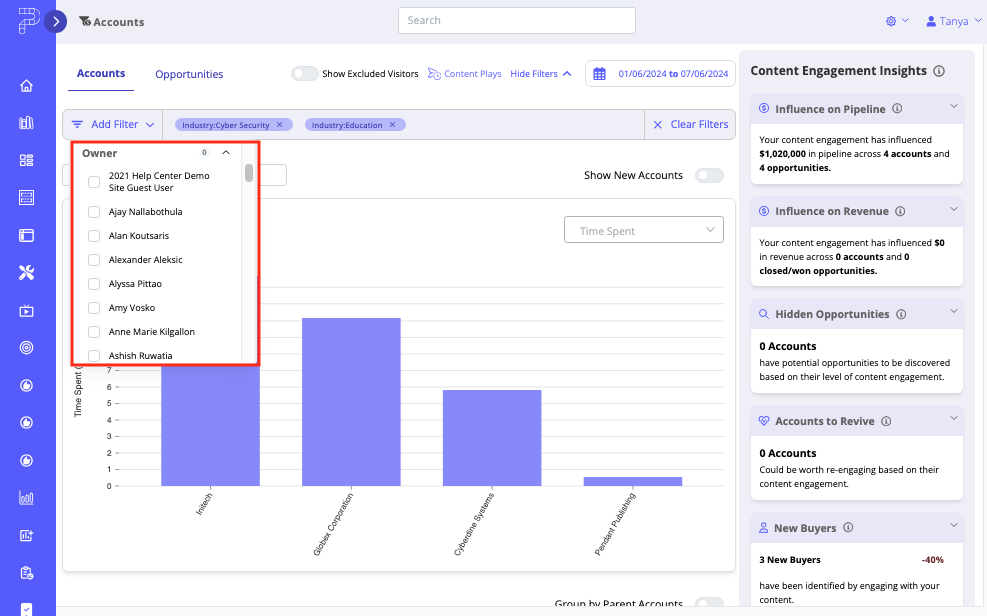
Team or Manager Role – If you have a team or manager role in Salesforce, you can switch to see My Team Accounts or select specific individuals within your team. This flexibility allows team leaders and managers to monitor the performance and engagement of their entire team or focus on specific team members.
Show New Accounts Toggle – Enable this toggle to update the bar graph to display new accounts created in your CRM within a date range. This feature is particularly useful for tracking the engagement and progress of recently acquired accounts, helping you to focus on onboarding and early engagement strategies.
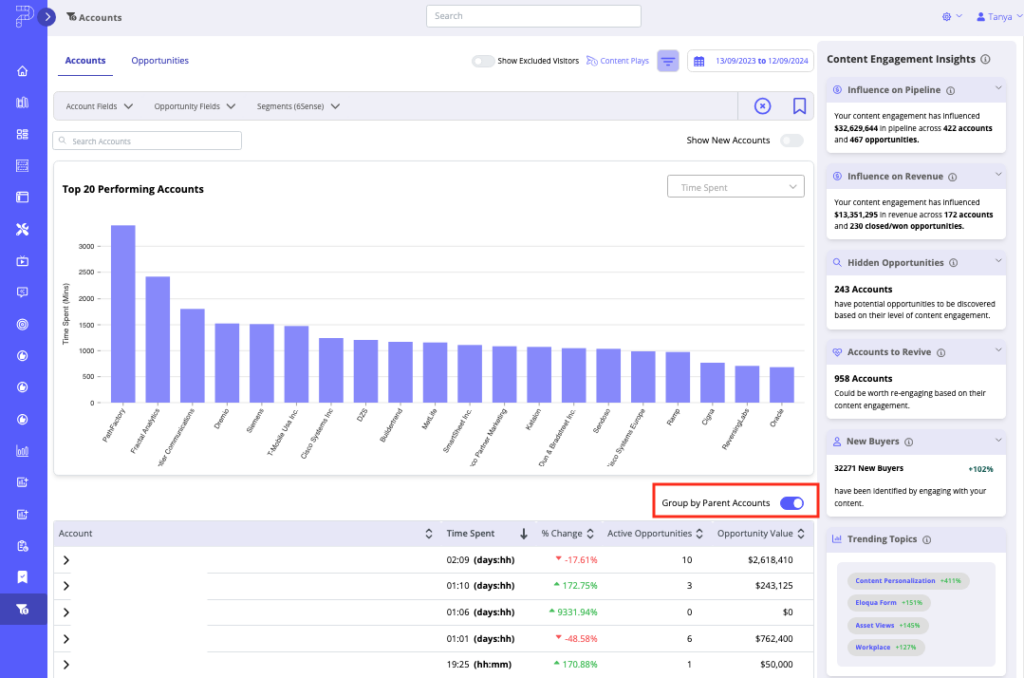
Group by Parent Accounts Toggle – Enable this toggle to adjust the data table to show the hierarchical relationship between parent and child accounts as defined in Salesforce. This view helps you understand the structure of larger organizations, allowing you to see how engagement varies across different parts of the same corporate family. This can be crucial for identifying key influencers and decision-makers within large, complex accounts.
Content Engagement Insights Definitions
This section describes the data being surfaced on the PFRI home page. When you first open PFRI, you see a panel on the right side that lists buyer insights at a glance.
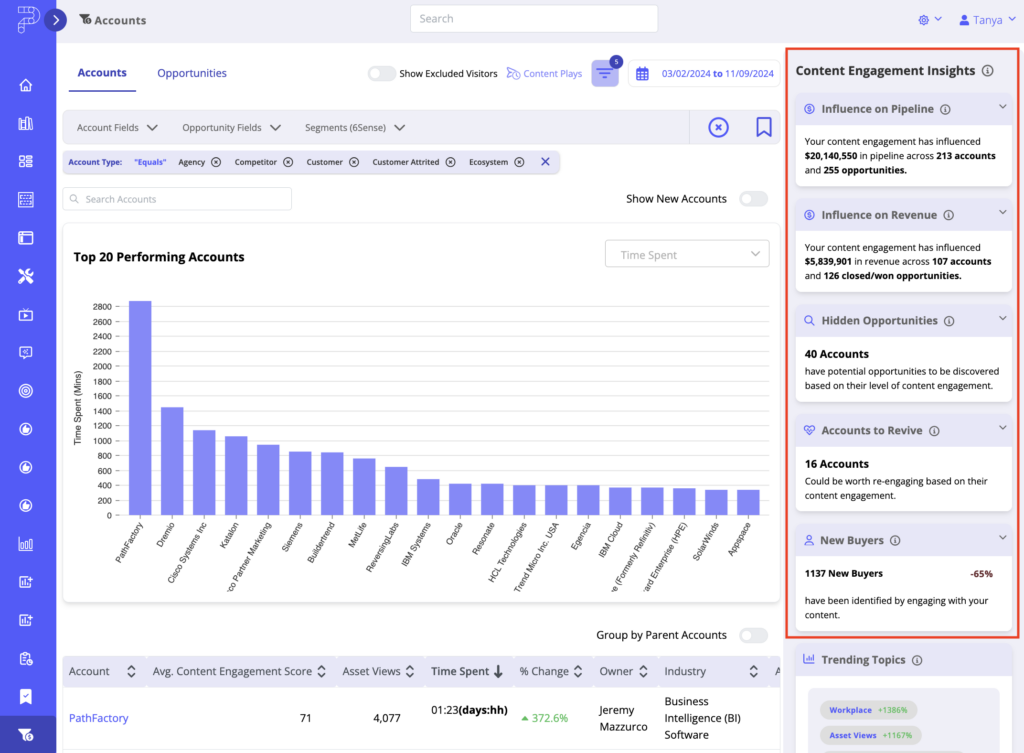
- Influence of Pipeline – Shows the influence that engagement with your content has had on your pipeline from a dollar perspective, as well as number of opportunities and accounts perspective. These are calculated by totalling the opportunities within accounts that had highly engaged sessions AND the sessions occurred before the opportunities moved to a closed stage.
- Influence on Revenue – Shows the influence that engagement with your content has had on your revenue from a dollar perspective, as well as number of opportunities and accounts perspective. These are calculated by totalling the opportunities within accounts that had highly engaged sessions AND the opportunities moved to a closed/won stage.
- Hidden Opportunities – Highlights accounts with highly engaged sessions that do not show any open opportunities – indicating that there may be potential hidden revenue opportunities to explore further and to prioritize those accounts for outreach.
- Accounts to Revive – Highlights closed/lost opportunities that may be worth re-engaging based on the highly engaged sessions occurring within the account. These sessions must have occurred AFTER an opportunity moved to closed/lost and no other closed/won or open opportunities are associated with the account.
- New Buyers – Lists new visitors who have not previously engaged with content assets in the date range selected. To see the top engaged known new buyers, click on the arrow key to expand the menu.You’ll see the list of their email addresses which you can click to go to their Buyer Details dashboard.
- Trending Topics – List of the most popular topics visitors engaged with in the time period selected.
Note: Highly engaged sessions are where a visitor has done any of the following:
- Met the engagement time threshold set for one or more pieces of content
- Viewed two or more pages
- Filled out a form
- Downloaded one or more content assets.
To view an overview of engagement for a specific account, scroll down and select an account from the table. You can also search for an account in the search bar.
When you open an account to view its engagement and opportunity details, you see three tabs along the top of the screen: Account Overview, Buyers Insight and Topics of Interest.
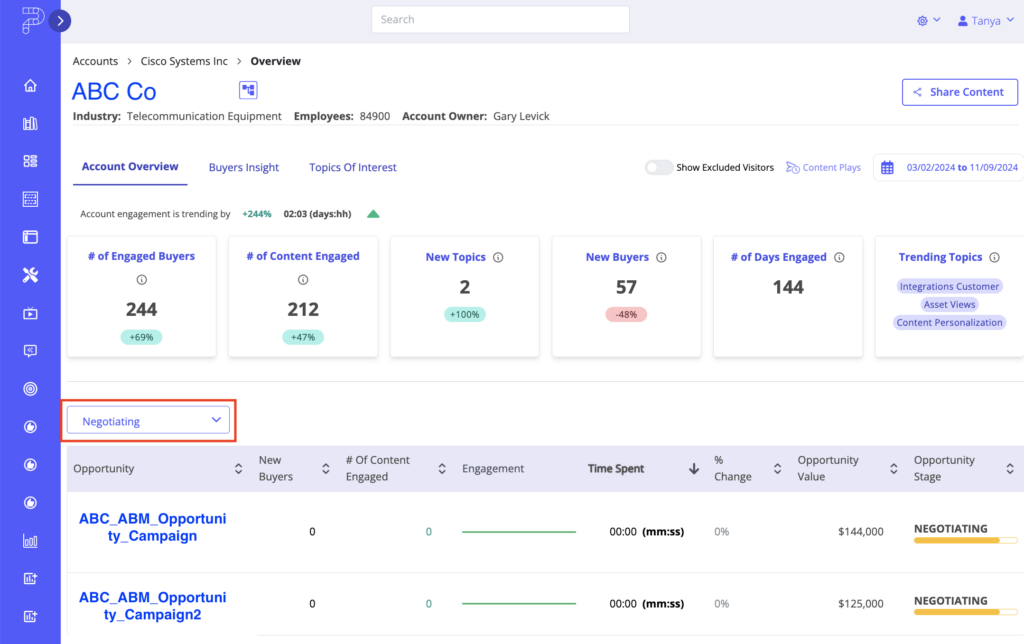
Account Overview
This tab is where you can see a high-level view of the account engagement for the period you have specified. It includes the number of engaged buyers, engaged content, new topics, new buyers, days engaged and the trending topics across the account. You can also see if the account engagement is trending positively or negatively compared to the previous period.
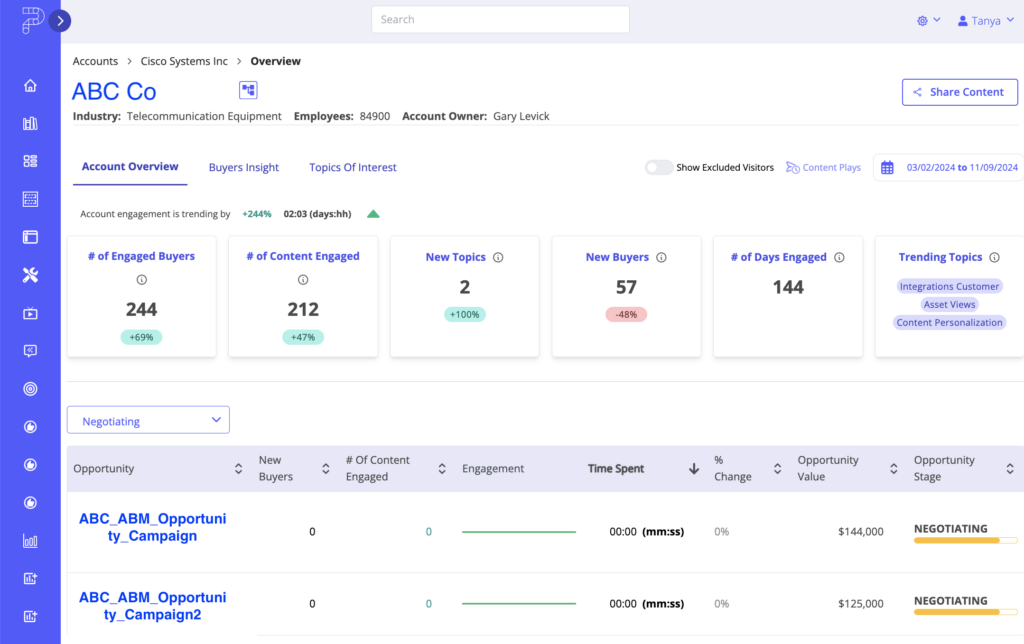
Below the summary cards is a table that lists the opportunities associated with the account selected. PathFactory surfaces the number of new buyers, content engaged, engagement trend, time spent and % change specific to each opportunity in this list.
To filter the opportunity list by stage click on the All Stages dropdown list as highlighted below.
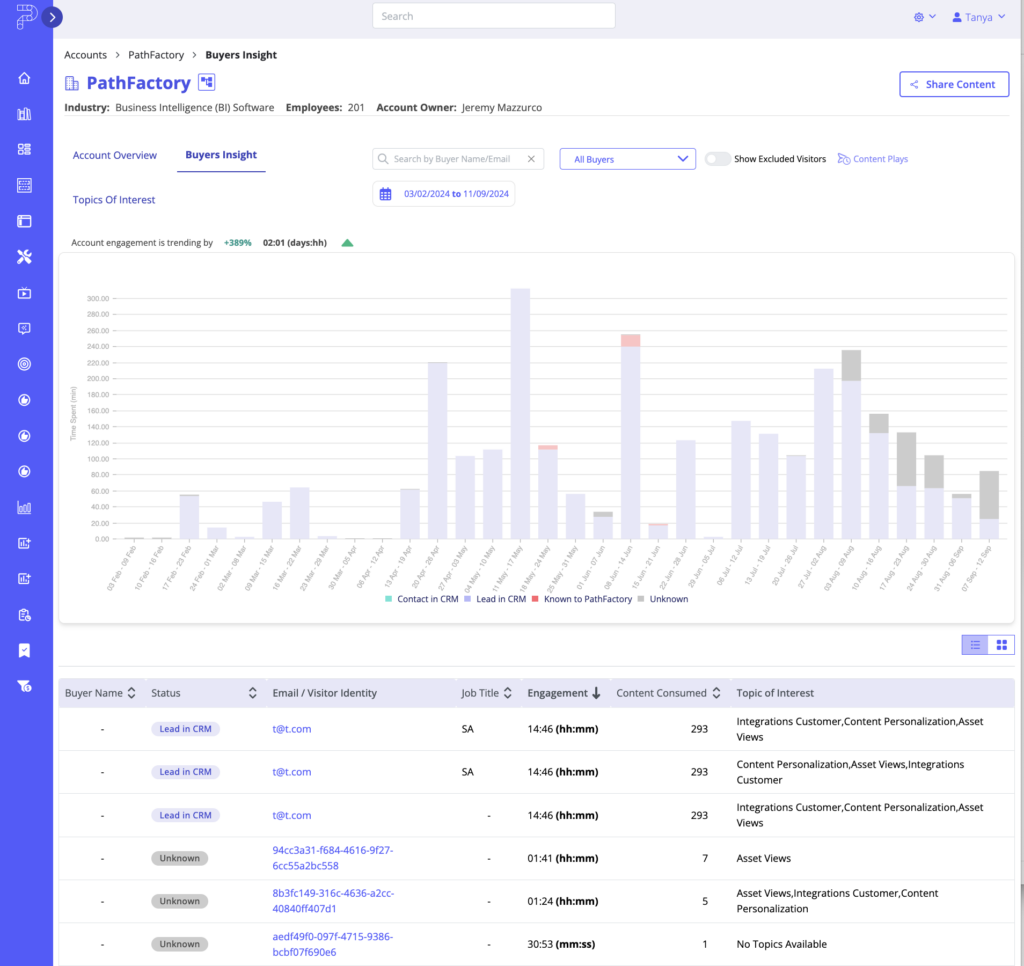
Buyers Insight
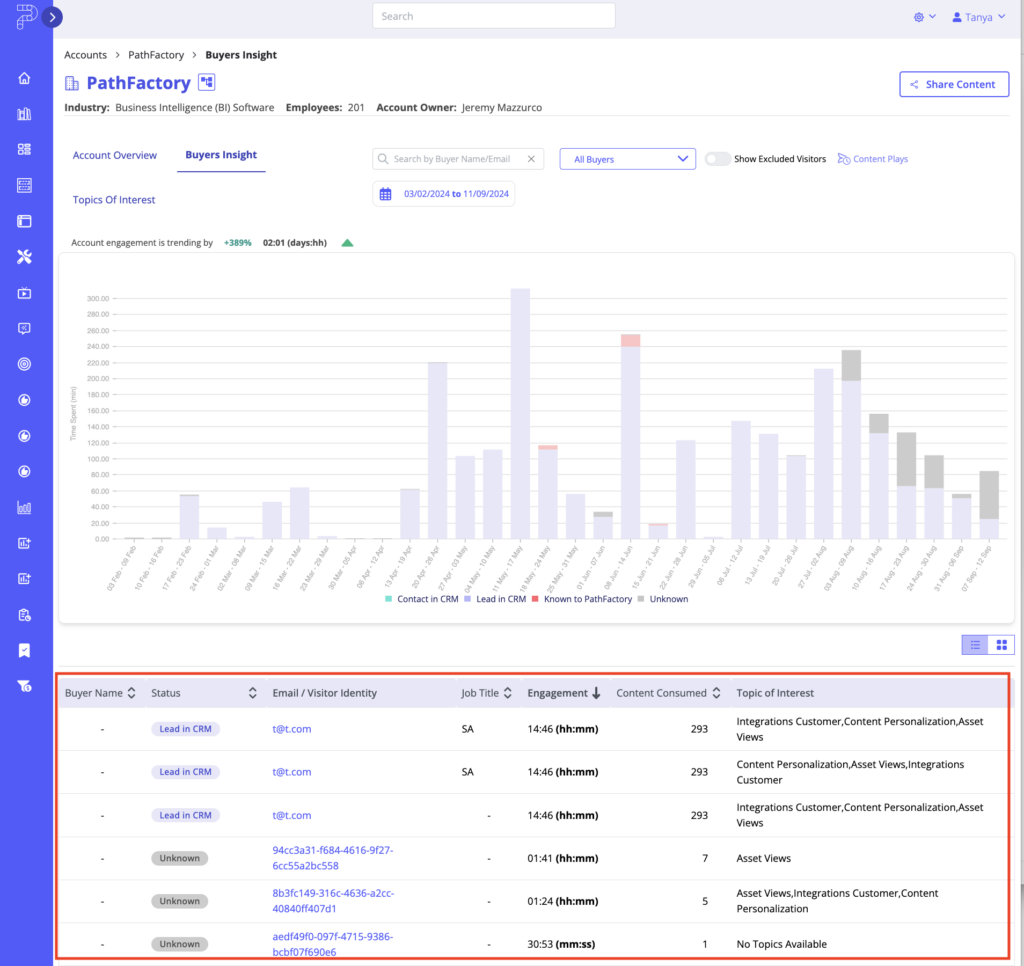
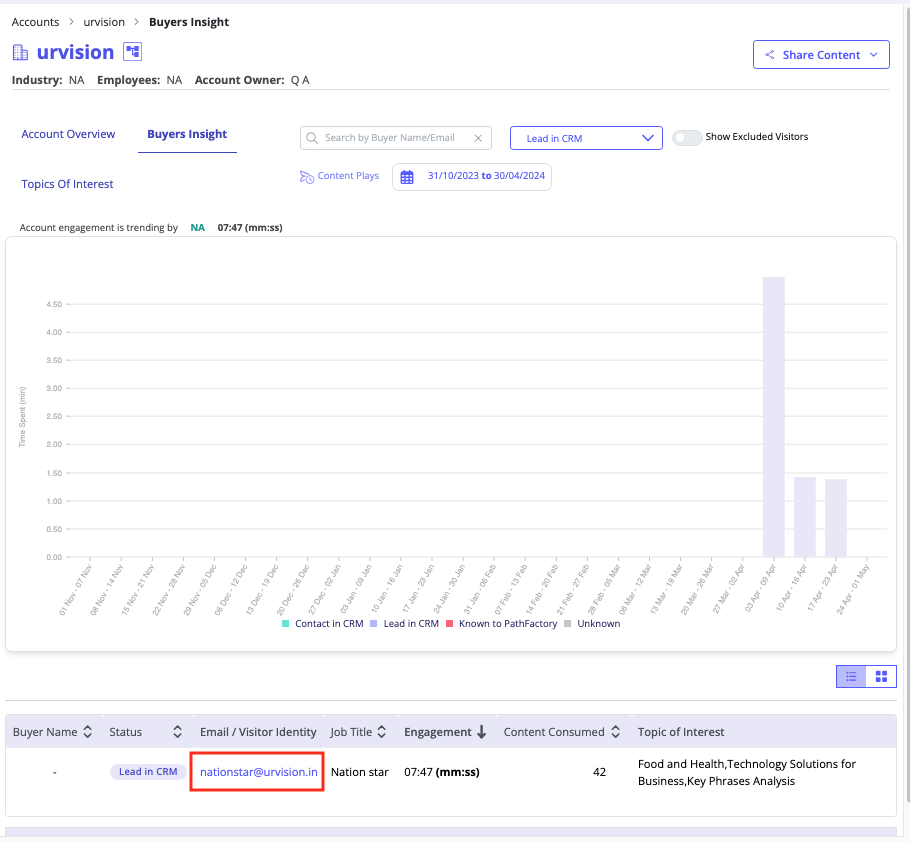
The Buyers Insight tab displays a timeline view of all buyers that have engaged with your PathFactory Content Experiences.
In a table below it, you can see the engagement time, number of content assets consumed and topics of interest for each buyer associated with the account as well as their buyer status.
At the top of the Buyers Insight tab you’ll see a dropdown list of the four buyer types: All Buyers, Contact in CRM, Lead in CRM, Known to PathFactory, and Unknown. Use the dropdown list to filter the buyer type you are interested in. Their names and definitions are listed below the following screen capture.
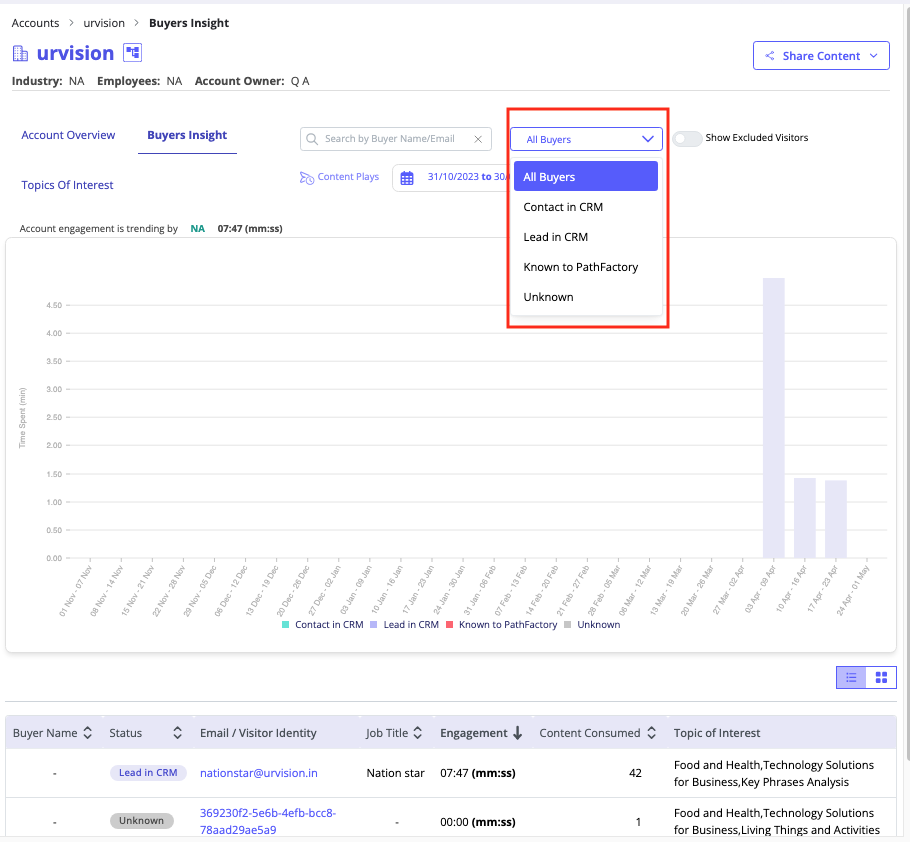
- Contact in CRM – Denotes buyers who are recognized as Contacts present in both PathFactory and Salesforce. These buyers have identifiable records in both PathFactory and Salesforce platforms.
- Lead in CRM – These are buyers who are recognized as Leads within Salesforce and are present in both PathFactory and Salesforce. These buyers have identifiable records in both PathFactory and Salesforce platforms, enabling you to track engagement data for the Contact.
- Known to PathFactory – These are buyers who are not recognized as Contacts or Leads within Salesforce but have interacted with PathFactory Content Experiences or tracked website pages. Engagement tracking and insights are associated with the email address for the visitor within PathFactory.
- Unknown – These are buyers who are engaging anonymously within PathFactory Experiences or tracked website pages with engagement tracking enabled via a unique anonymous visitor ID. Any anonymous visitors to accounts that PathFactory can associate with an account will show up with the “Unknown” buyer status type label in reporting views.
How to View a Buyer’s Content Journey
To see which content assets a buyer has engaged with the most often, and get recommendations of which content assets to send to them next, follow these steps.
- On the Buyers Insight tab, first select the account’s email address from the table below the graph.

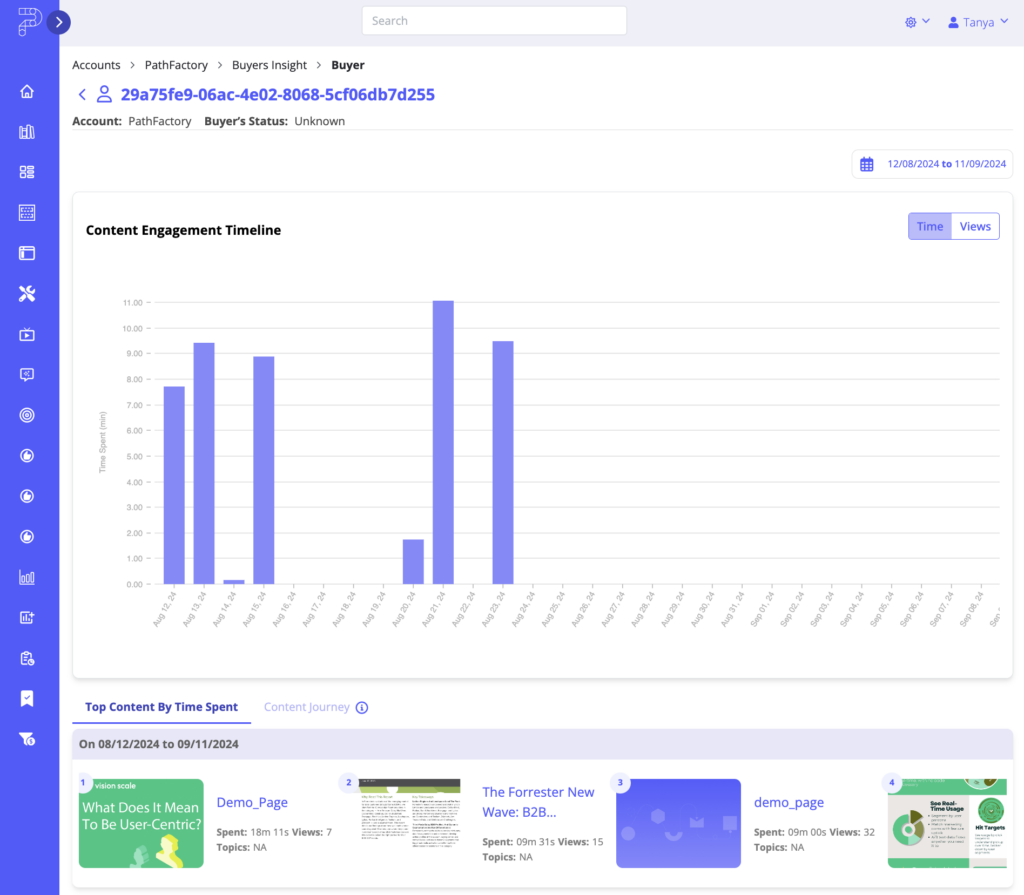
- Now you will see the data for the individual buyer. On this page you have a graphical representation of their engagement, two tabs – Top Content By Time Spent and Content Journey – plus recommendations on what content assets to send next to this buyer to encourage further engagement.

How are Contacts in PFRI Evaluated?
Contacts in PathFactory for Revenue Intelligence are evaluated using the following process:
- The visitor (buyer) record in the PathFactory database is known and PathFactory has their email.
- PathFactory looks to see if this email matches any existing contact records being imported from Salesforce as part of the PFRI integration.
- If there is a match, PathFactory will establish this visitor with a buyer status of “Contact in CRM” on their buyer page.
- This buyer page will also be displayed as an embedded view on the associated contact record page in Salesforce. Below is an example of the Buyers Insight tab, displaying in graph and list form the buyer status for an account. The buyer status key is highlighted with a red rectangle.
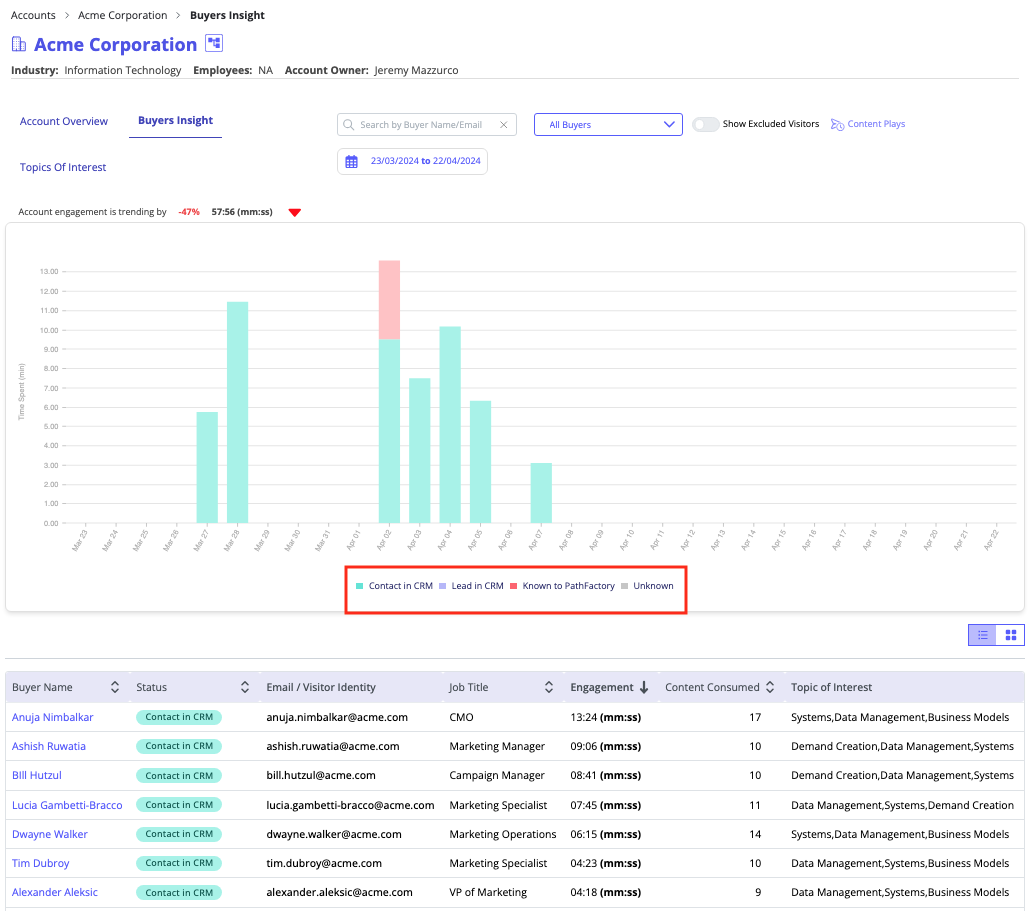
By viewing the buyer status, you can get a better picture of the full buying committee that may have been hidden previously. You can also narrow in on more granular insights by date or by buyer status, as well as click into a buyer’s details page as shown below. Based on the status types displayed in the table, you can click on:
- The name of a buyer that is present in the CRM
- The email address of a buyer that is not present in the CRM (but known to PathFactory)
- The visitor ID of an unknown buyer
Buyer Details Dashboard
The Buyer Details dashboard displays the timeline of engagement for an individual buyer. You can filter the date to narrow in on a shorter period of time or expand out to a longer period of time. Based on the period selected, you can either see Top Content by Time Spent or Views for the individual buyer.
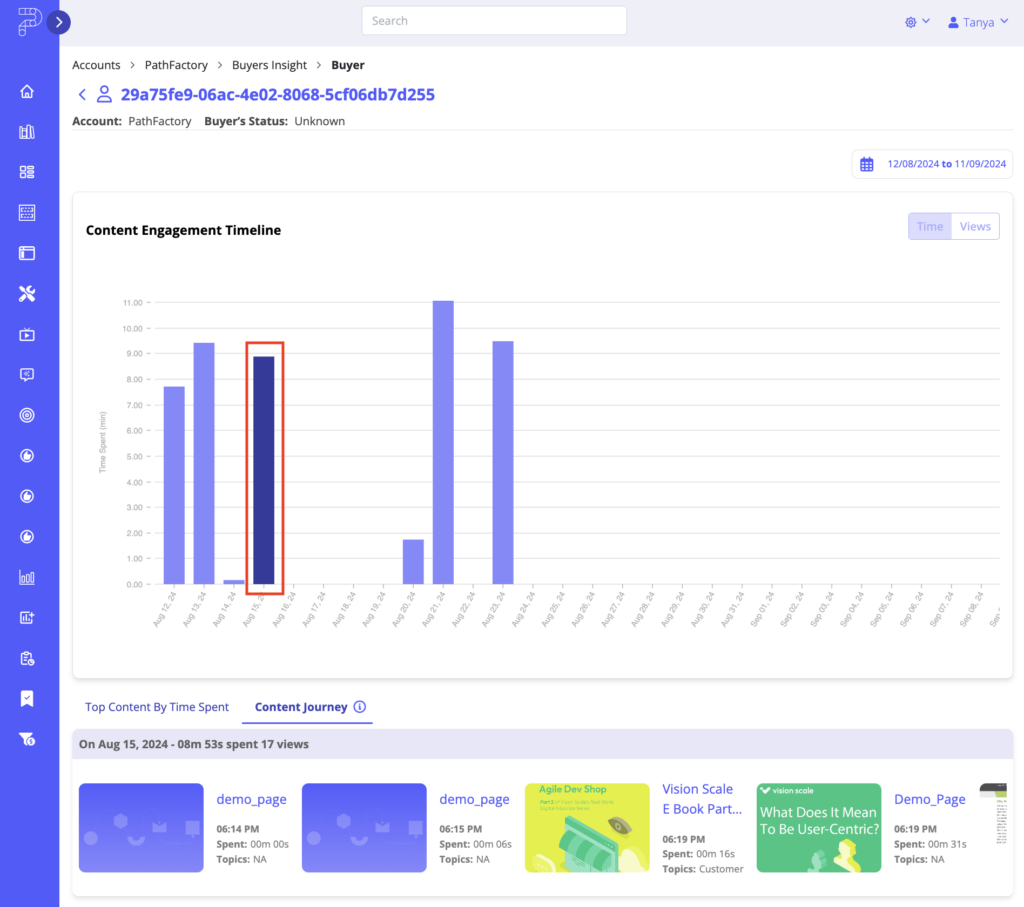
You can also select a specific day on the bar graph which will enable the Content Journey tab as shown below. This tab provides a complete breakdown of the journey the buyer took through your content on that day, showcasing the order in which they viewed the assets and how long they viewed them for.
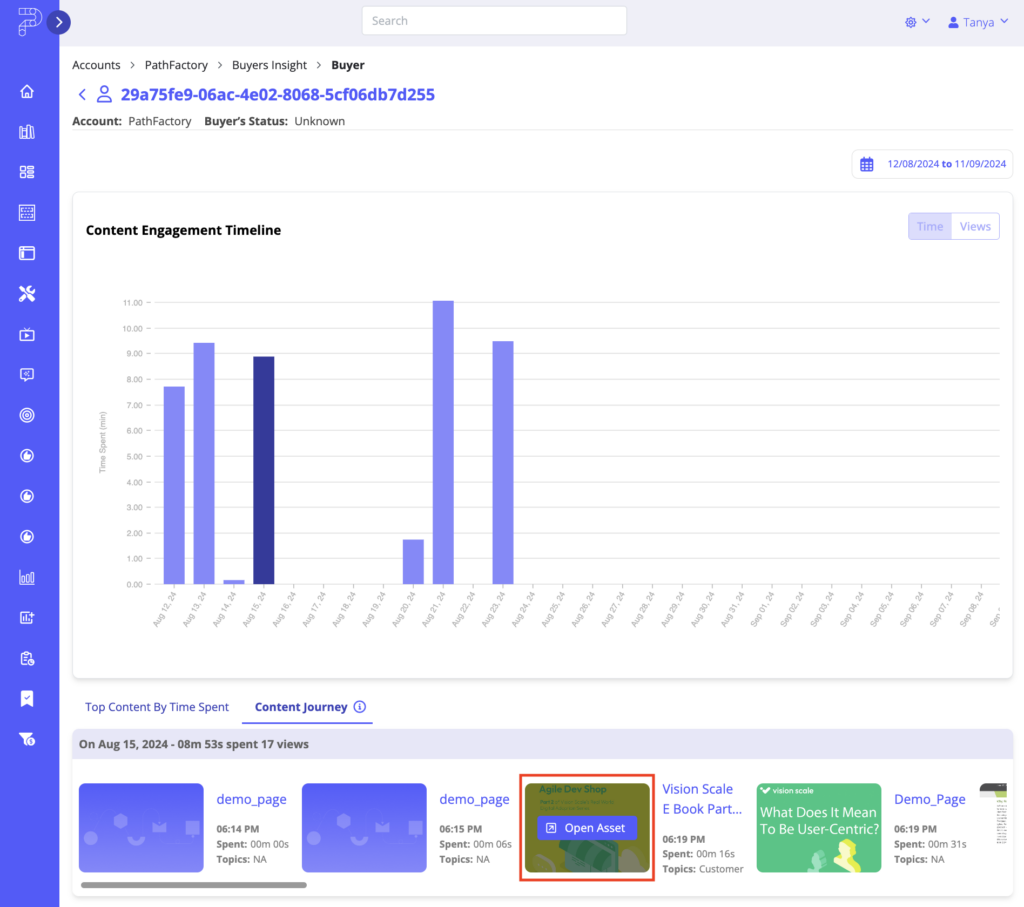
If you’d like to browse through any of the content assets in the journey view, you can click on the content thumbnail or title and it will open that content in a new tab within the Content Experience the buyer engaged with when they consumed the asset.
To see which content assets a single buyer has engaged with the most often, and get recommendations of which content assets to send to them next, follow these steps.
- On the Buyers Insight tab, first select the account’s email address from the table below the graph.
2. Now you will see the data for the individual buyer. On this page you have a graphical representation of their engagement, two tabs – Top Content By Time Spent and Content Journey – plus recommendations on what content assets to send next to this buyer to encourage further engagement.
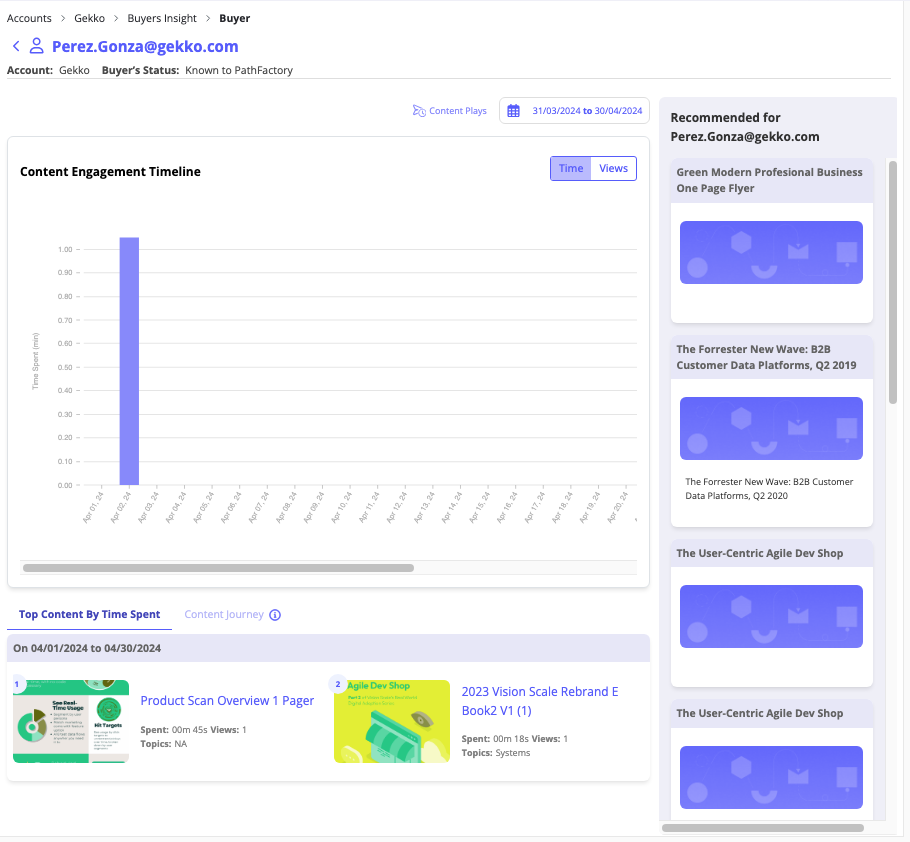
3. To select a specific day on the bar graph and see a complete breakdown of the journey the buyer took through your content on that day, on the graph select one day, as shown below.
4. To browse through any of the content assets in the journey view, you can click on the content thumbnail or title and it will open that content in a new tab within the Content Experience the buyer engaged with when they consumed the asset.
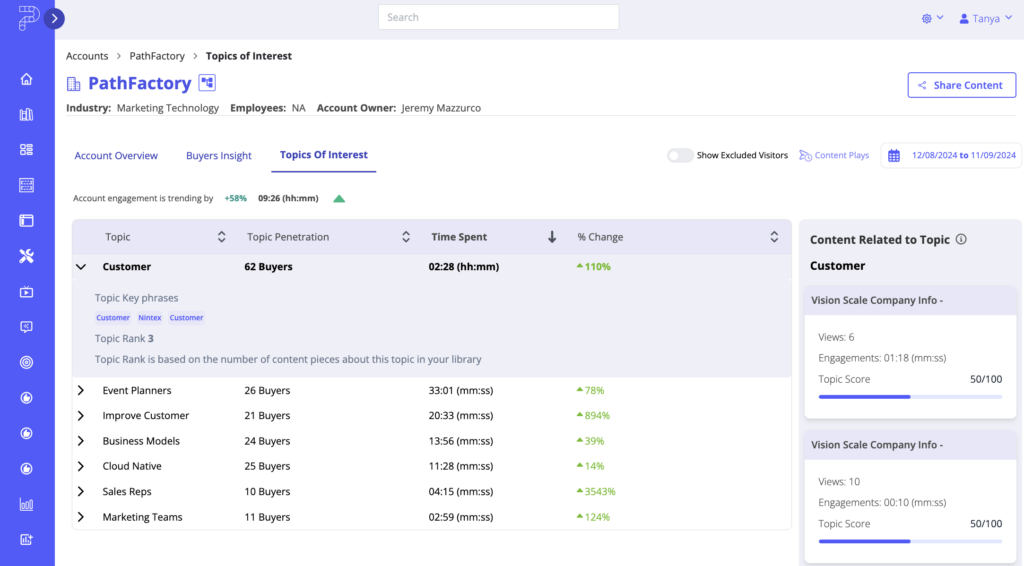
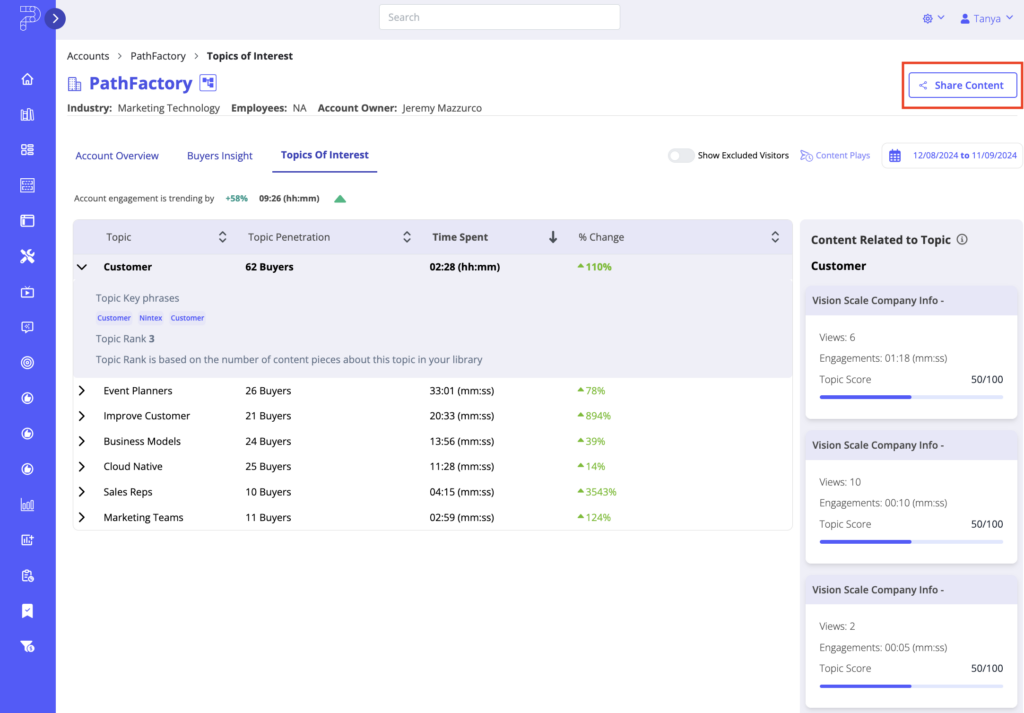
Topics of Interest
The Topics of Interest tab displays the topics that your buyers within an account have been engaging with. The topic values displayed within this list will come from one of two places:
- If you’re a Website Tools customer, these topics will be generated by PathFactory AI after running an analysis of your content.
- If you’re not a Website Tools customer, these topics will pull from the manually assigned topics you apply to content when it gets added to/edited in the PathFactory Content Library
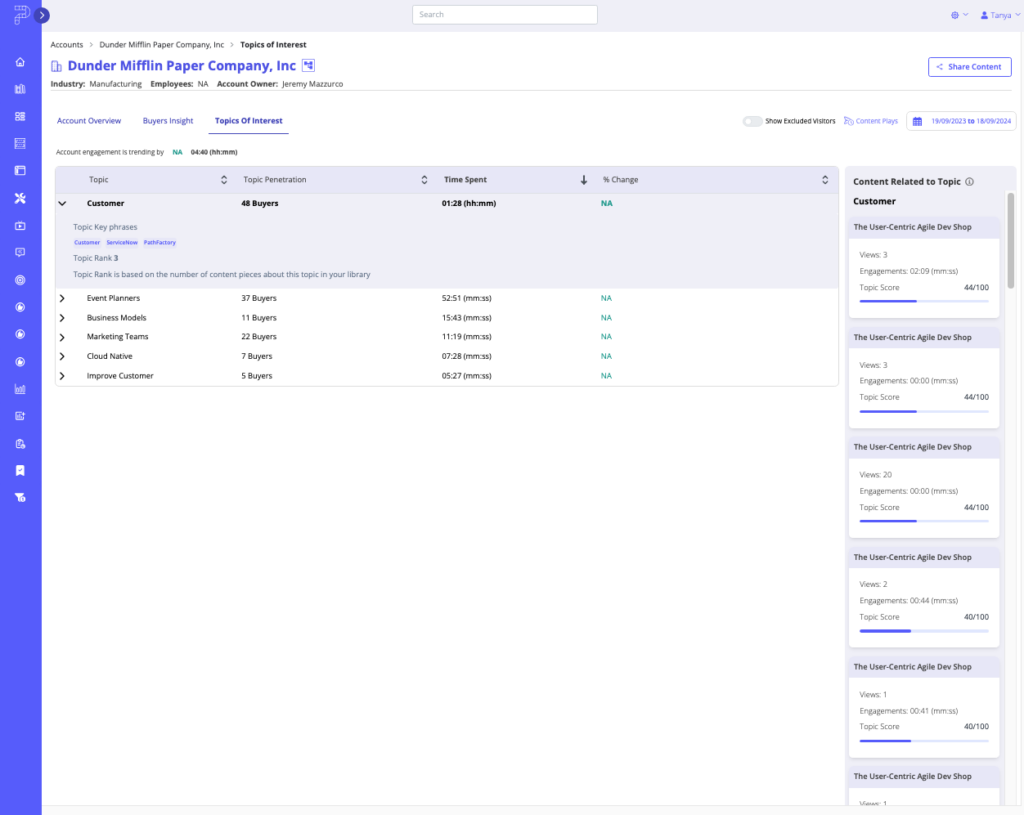
If you have topics generated from PathFactory AI, when you click to expand one of them you will see the associated Key Phrases. Key Phrases are a collection of keywords that logically cluster together under a common topic based on their meaning and relatedness.
You will also see a Topic Rank, which is based on the number of content pieces in your library relating to this topic. If you have manually curated topics, Key Phrases and Topic Rank data will not display.
In addition to the expanded drop down view that displays when you select a topic, you will also see a right pane displaying the content that buyers at this account have engaged with that are associated with that topic. Engagement time and views will display. If you have AI generated topics, then the Topic Score for each content asset will also display. Topic Score is based on a PathFactory algorithm and highlights the level of relevance that asset has to the topic.
Sharing Content Using Sales Content Plays
Within an Account, users have the ability to share content with buyers, in addition to reviewing their content engagement.
To initiate the content sharing workflow (known as a Content Play in PathFactory), users can navigate to the Share Content button that displays on the top right of the Account page.
A menu opens for you to select the Content Experience to send out.
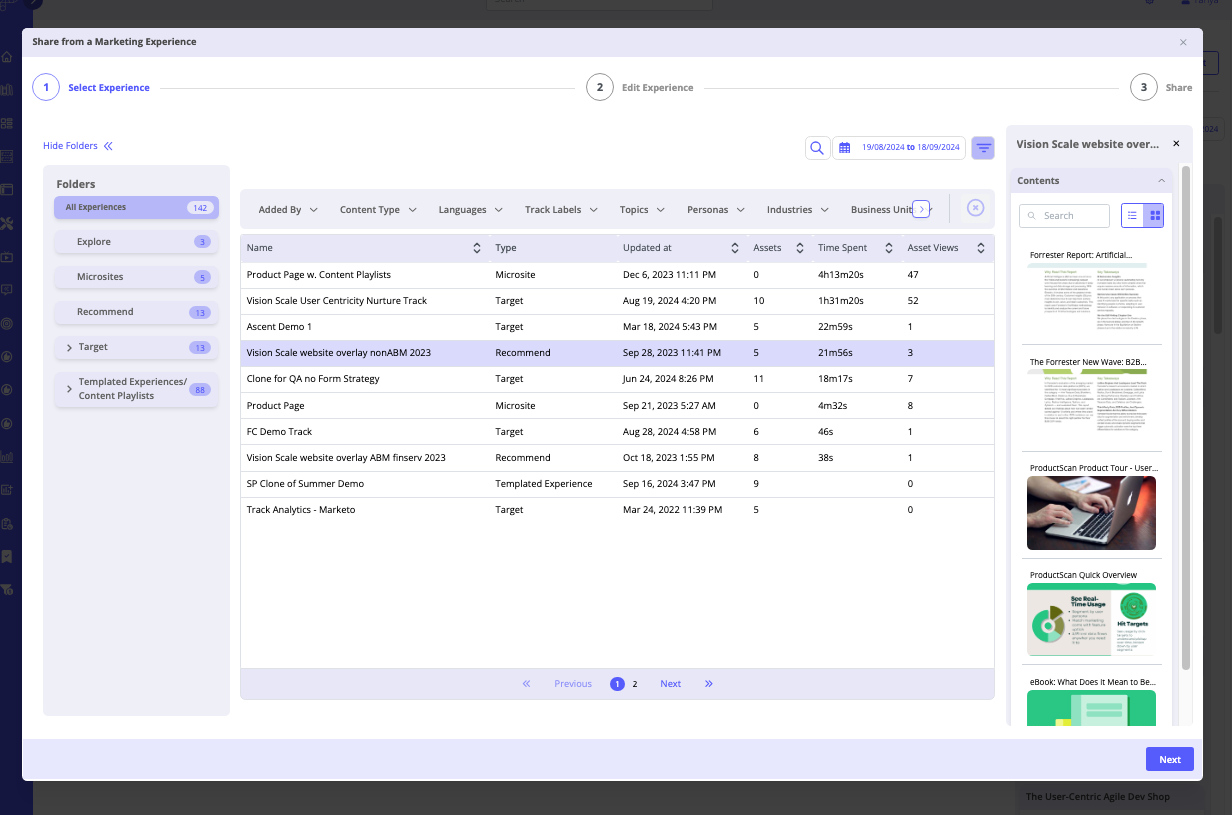
Select the content you want to share, and follow the prompts to complete the process.
To learn more about PathFactory’s Content Plays, read How to Use PathFactory for Revenue Intelligence Content Plays.
Opportunities Dashboard
To view engagement across all open opportunities, as well as broken down by pipeline stage, you can navigate to the Opportunities tab from the main PFRI Accounts view, as highlighted in the screen capture below.
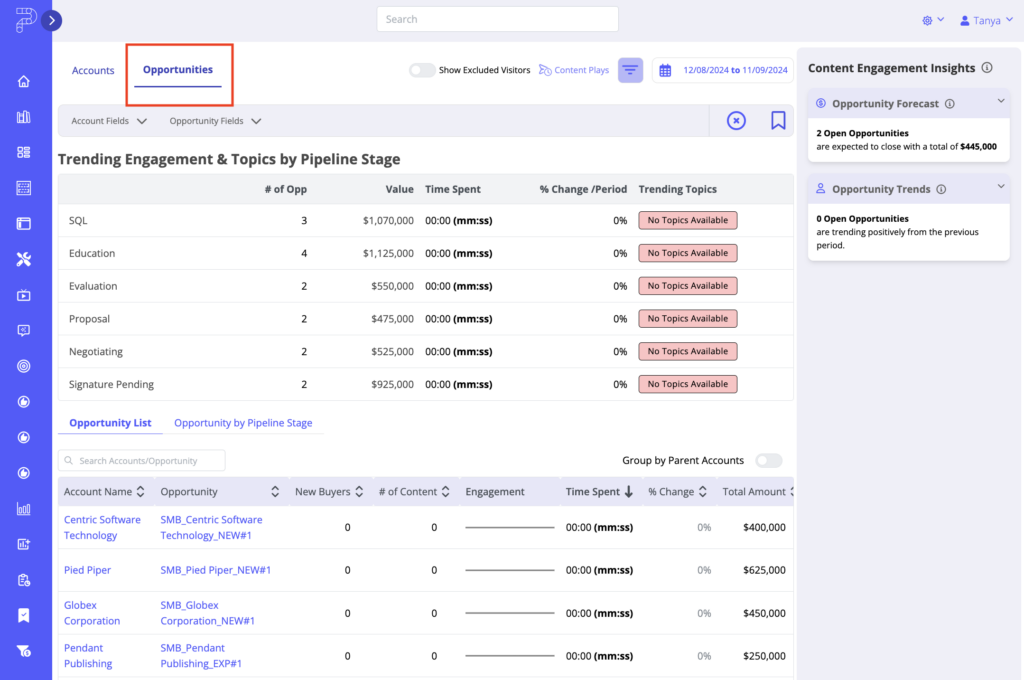
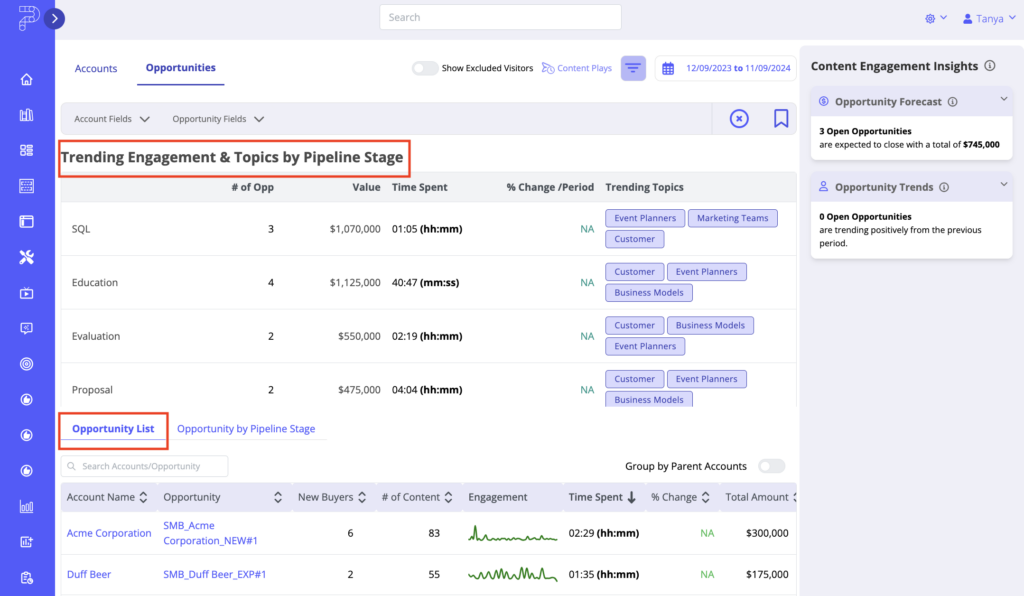
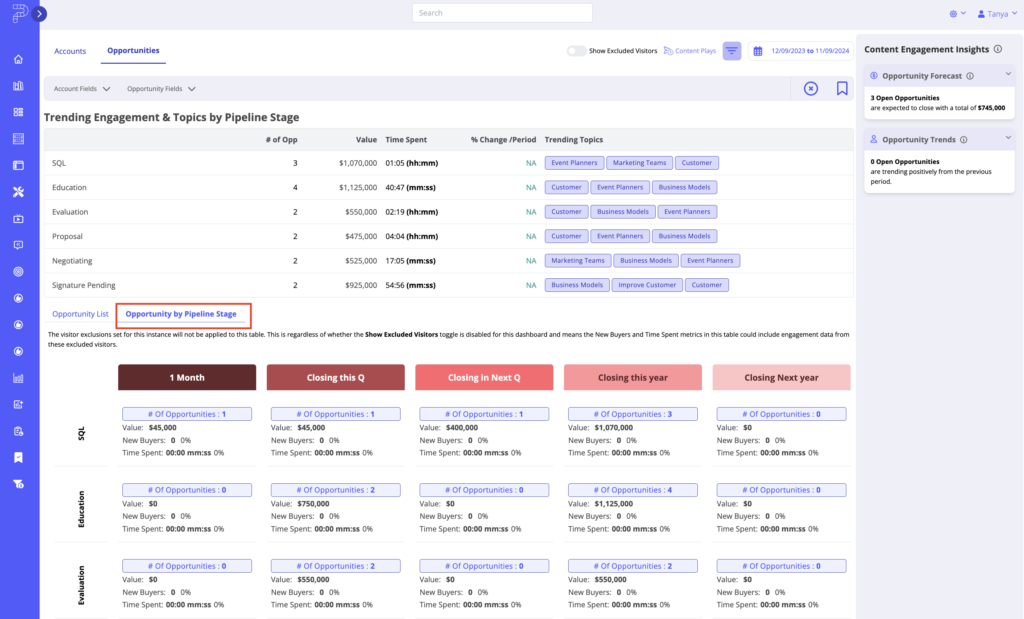
When you enter the Opportunities dashboard, you will first see a table that breaks down all engagement by pipeline (opportunity) stages in your CRM. In addition to this, there are two sub-tabs available below this called Opportunity List and Opportunity by Pipeline Stage.
- Opportunity List – this is a list of all open opportunities in your CRM, with engagement data for contacts that have been associated to each opportunity
- Opportunity by Pipeline Stage – This is a graphical representation of opportunities grouped by industry, time since campaign launched, timing for closing the deal, based on engagement data: 1 Month, Closing this Q, Closing Next Q, Closing This Year and Closing Next Year. (see example below for this view)
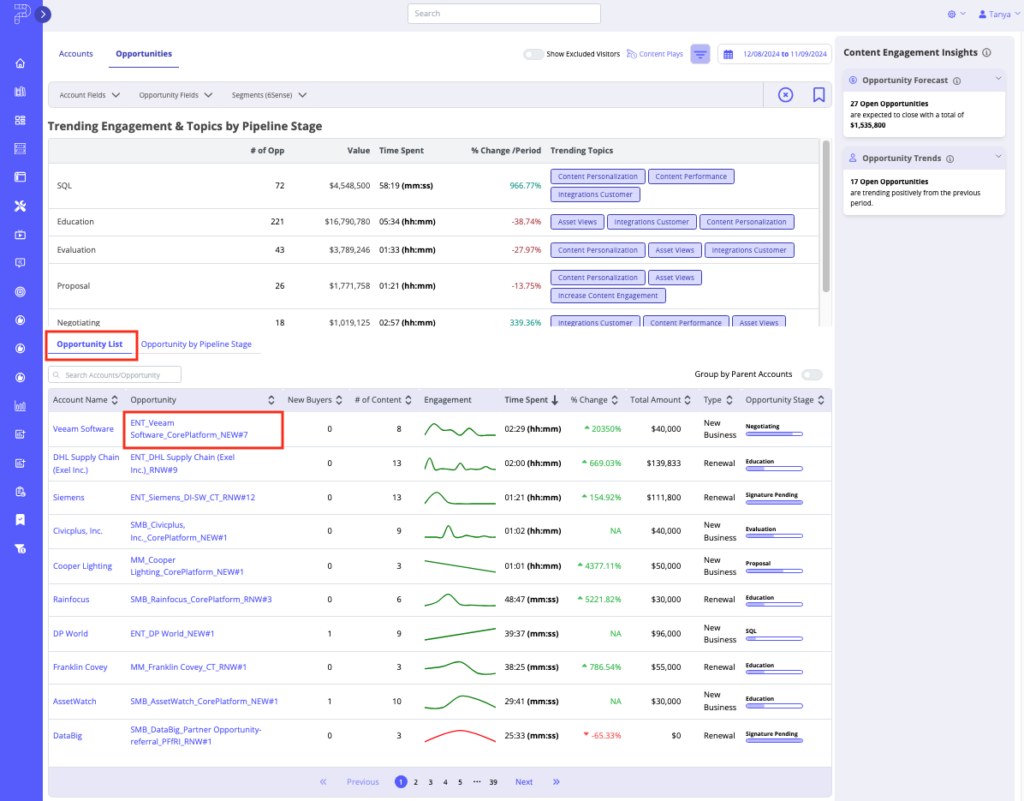
There are also Content Engagement Insights available on the right pane similarly to the Accounts dashboard.
Content Engagement Insights Definitions
- Opportunity Forecast – Totals all open Opportunities with close dates set in the date range you have applied.
- Opportunity Trends – Totals all open Opportunities where content engagement that occurred in the date range applied increased compared to the previous period. For example, if you had the past month selected, then the previous month before that would be compared against.
If you’d like to view content engagement related to a specific Opportunity, select the Opportunity List sub-tab and click on one of the Opportunity names. You can also search by Opportunity name in the search bar.
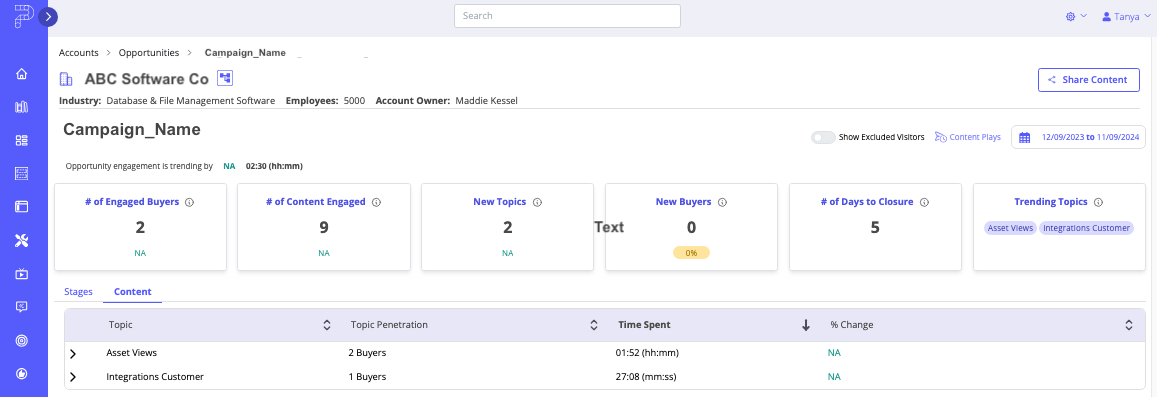
Individual Opportunity Dashboard
Once you are on the individual Opportunity dashboard, you will be able to see a summary of engagement outlined in the cards at the top. This includes number of Engaged Buyers, number of Content Engaged, New Topics, New Buyers, number of Days to Closure and Trending Topics.
The important differentiation between these cards at the Opportunity level versus the Account level is that the Opportunity dashboard only displays content engagement from Contacts associated with the Opportunity in the CRM, while the Accounts page displays content engagement from ALL buyers associated with the Account, whether its contact records in the CRM or through their email domain/company name match data from Demandbase.
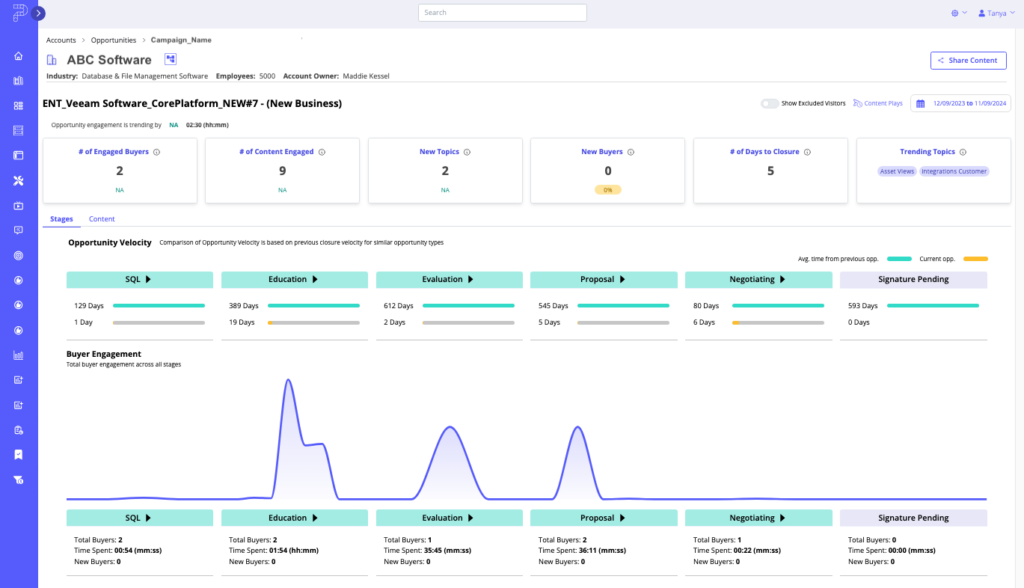
Stages
This tab surfaces the pace at which the Opportunity moves through the different stages, based on the data PathFactory collects from your CRM. A buyer engagement graph is then mapped directly below those stages to help you correlate the impact that your content engagement has had on the velocity of your Opportunities.
When comparing average time from previous opportunities, this is specific to closed/won opportunities for accounts in the same industry.
By default, this tab will display when you land on a specific Opportunity.
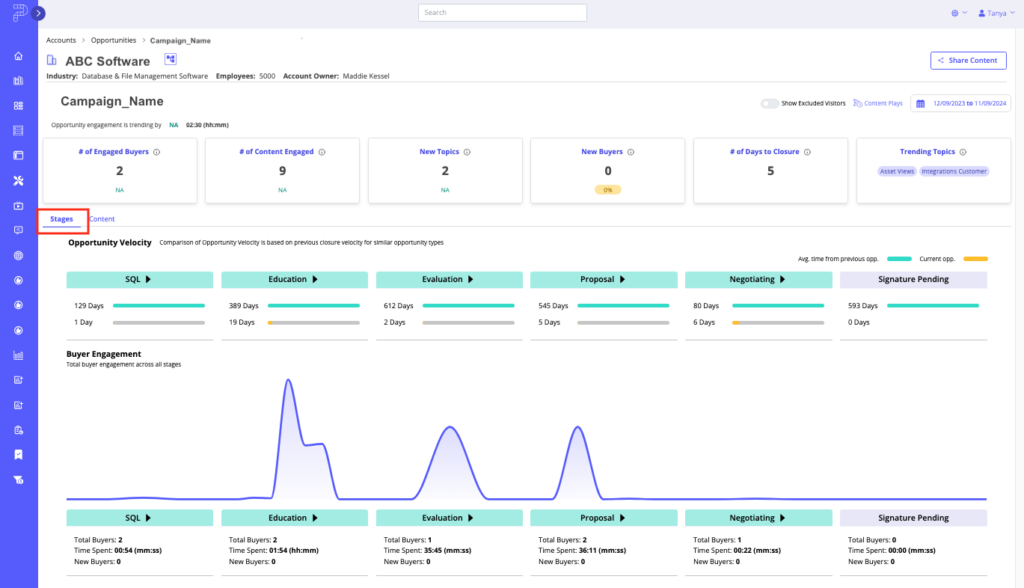
Content
This tab showcases the same Topic of Interest Insights that you would see at the Account level, however these are narrowed in to focus on engagement occurring from Contacts that have been associated with the Opportunity in your CRM. Refer to the Topics of Interest section of this article for more information on the data definitions.
For further information on any of the data terminology included in PFRI, read our full list of PFRI Buying Signal Definitions.
Views: 225