The form performance report type is found within the Reports tab in Templated Experiences. The Form Performance report provides a summary of engagement and data that indicate the effectiveness of the forms that have been presented to visitors on a Templated Experience Landing Page or Content Page. The data presented on this tab enables you to gain insights into form engagement and conversion rates and optimize content, based on visitor interactions.
Note: To extract meaningful data for a form performance report, you must have already added content to the Templated Experience, added a form, and there must have been some interaction from your visitors.
To use this feature, follow these steps.
- Open a Templated Experience in edit mode. To do this, follow these navigation instructions depending on which version of PathFactory your organization is using.
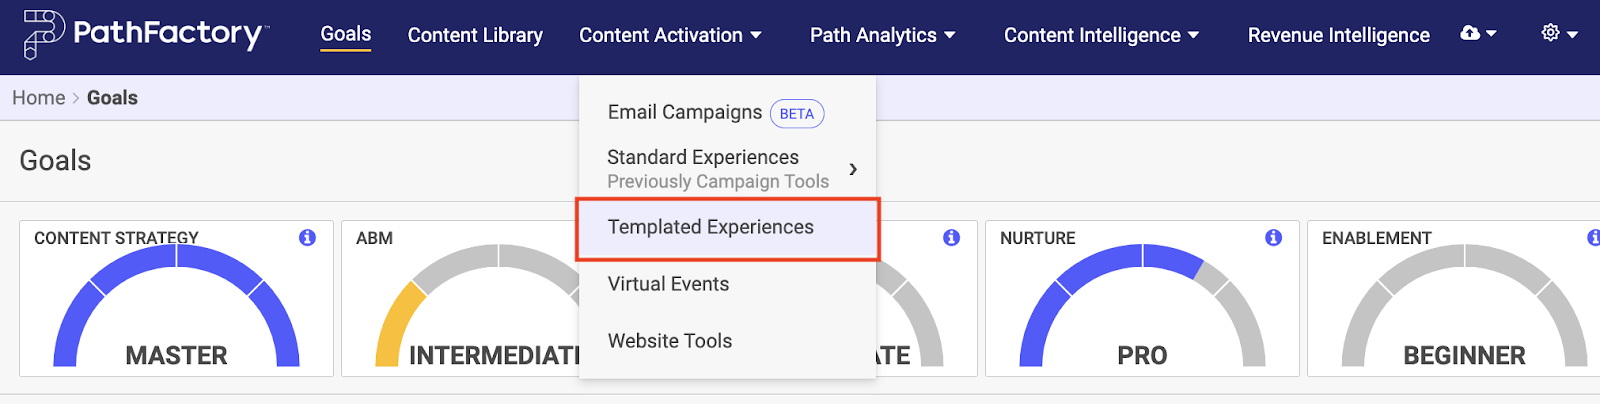
- In the legacy interface, on the top navigation click Content Activation and then select Templated Experiences.
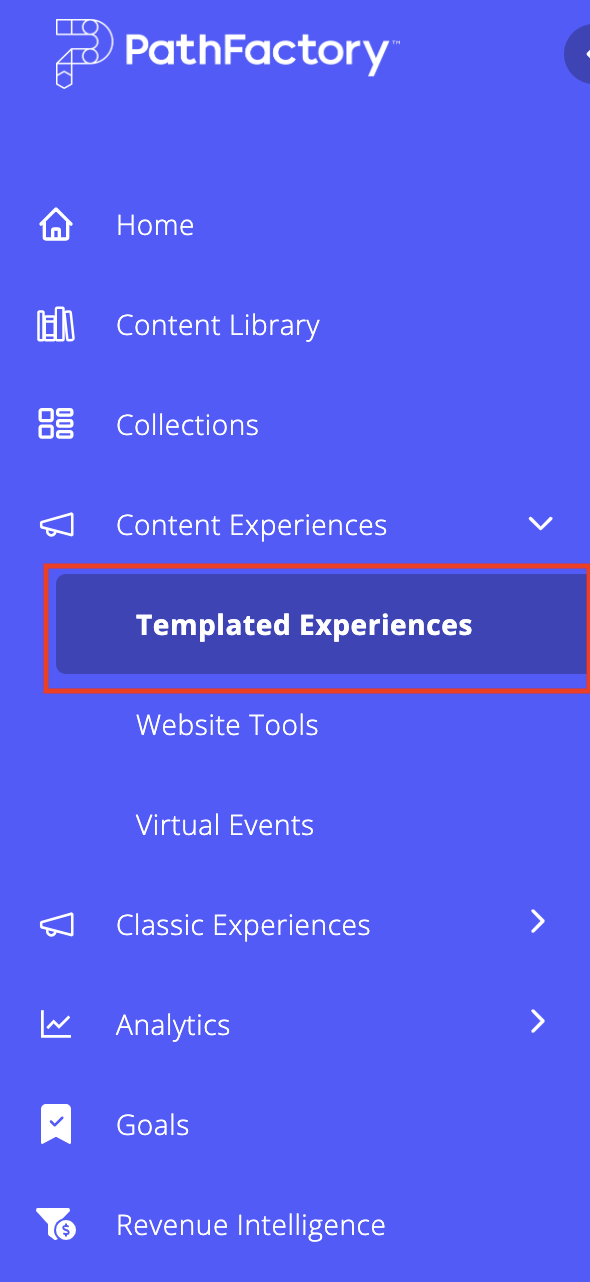
- In the latest interface, expand the panel on the left side and then select Templated Experiences.
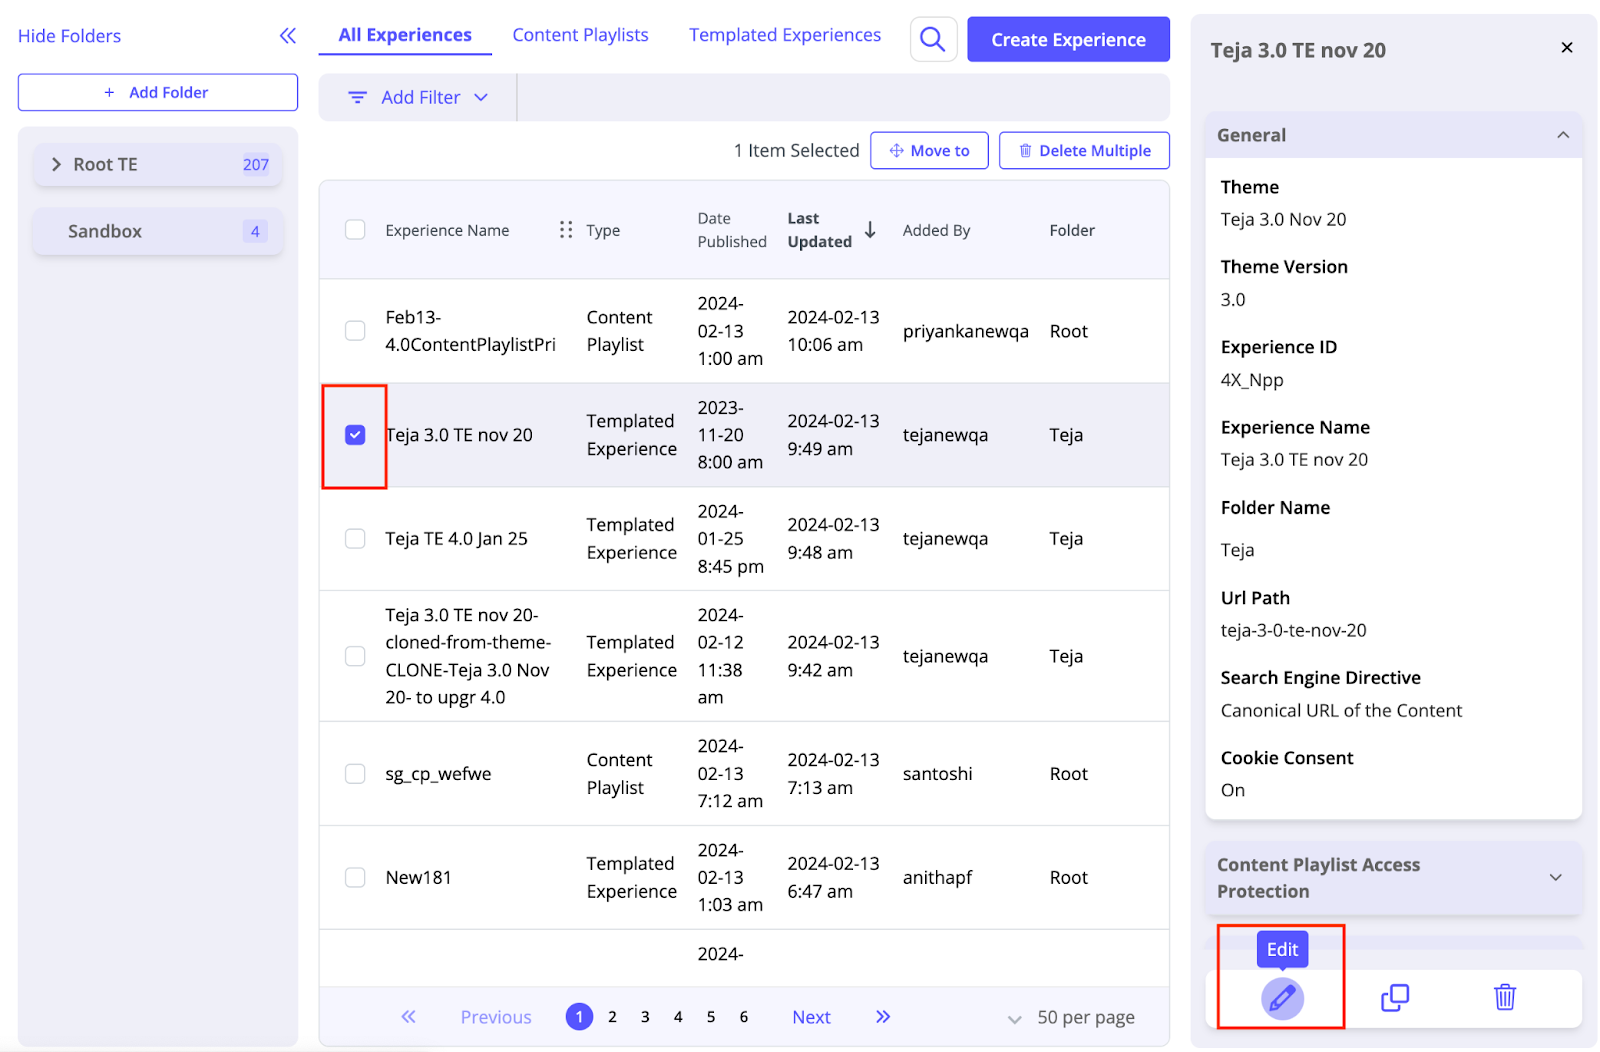
- In the list that appears, select the checkbox for the Templated Experience you want to edit, and then select the edit icon, as shown below.
- With the Templated Experience open, select its Analytics tab.
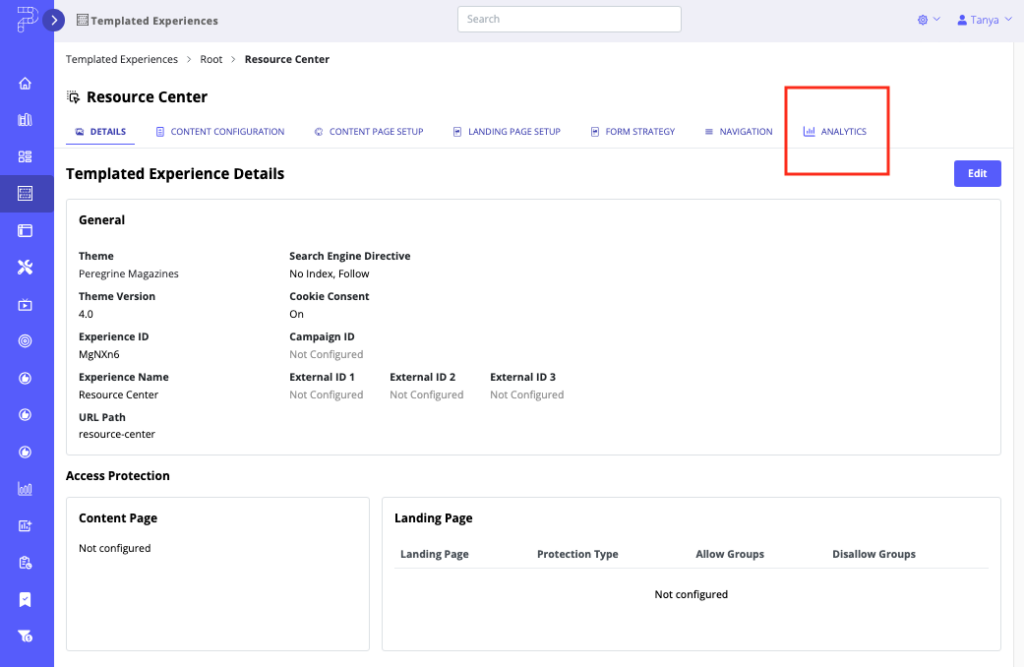
- Next, select the Form Performance sub tab.
The following data is available in this report.
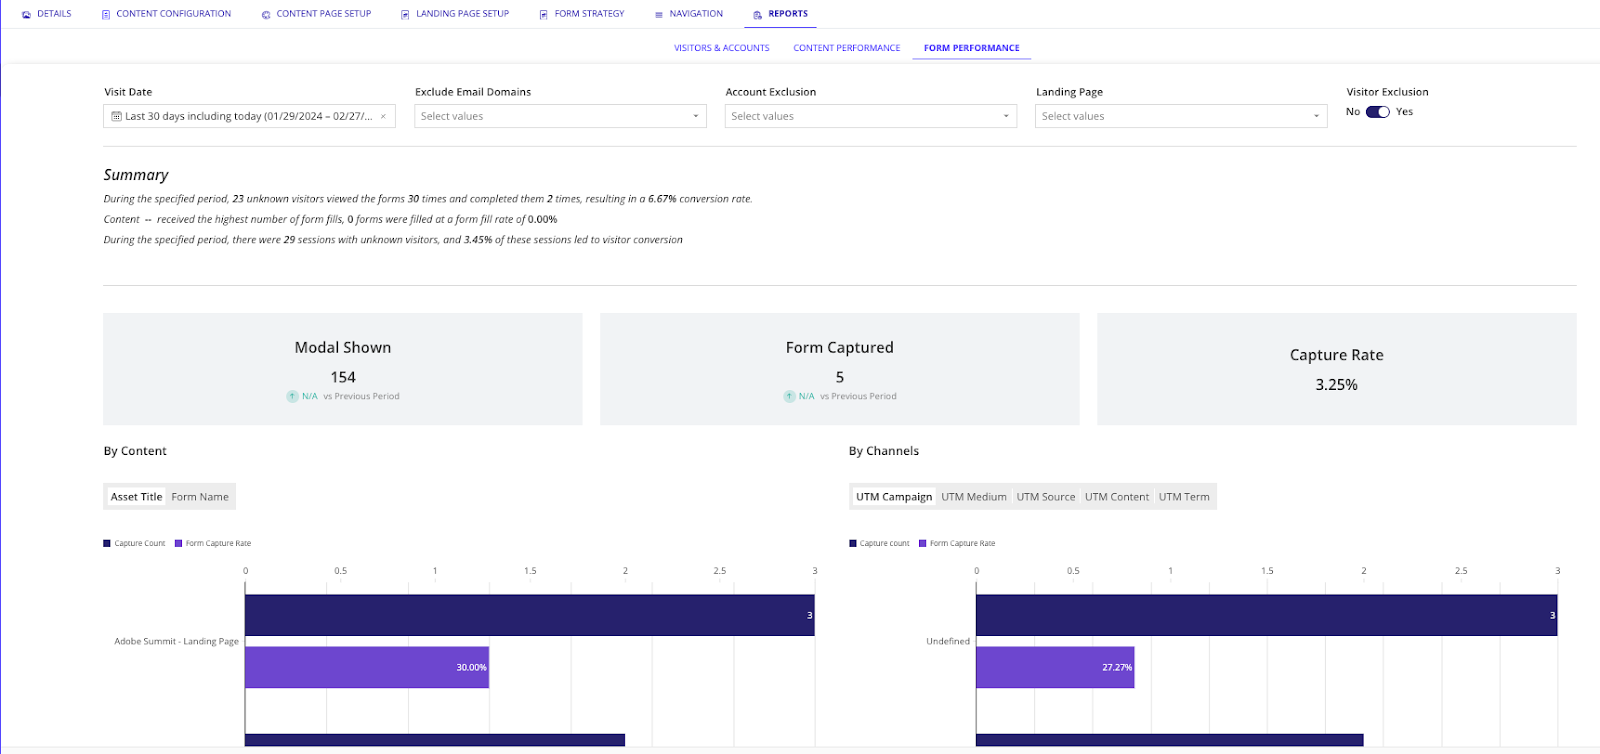
- Summary: This statement at the top of the dashboard view summarizes the data on the dashboard related to form performance and effectiveness. These insights include:
- Number of Visitors: Total visitor count, including unknowns.
- Number of Form Presentations: Total form displays, with specific counts for unknown visitor presentations.
- Number of Form Submissions: Total submissions, with unknowns indicated.
- Conversion Rate: Overall and unknown visitor conversion rates for form effectiveness assessment.
- Most Filled Form: Identifies the form with the highest submissions, reflecting its popularity and effectiveness.
- Sessions with Unknown Visitors and Their Conversion Rate: Details sessions involving unknown visitors, with corresponding conversion rates enclosed in brackets for this group’s assessment.
Displayed below is an example of a Summary statement, as seen on the Form Performance tab.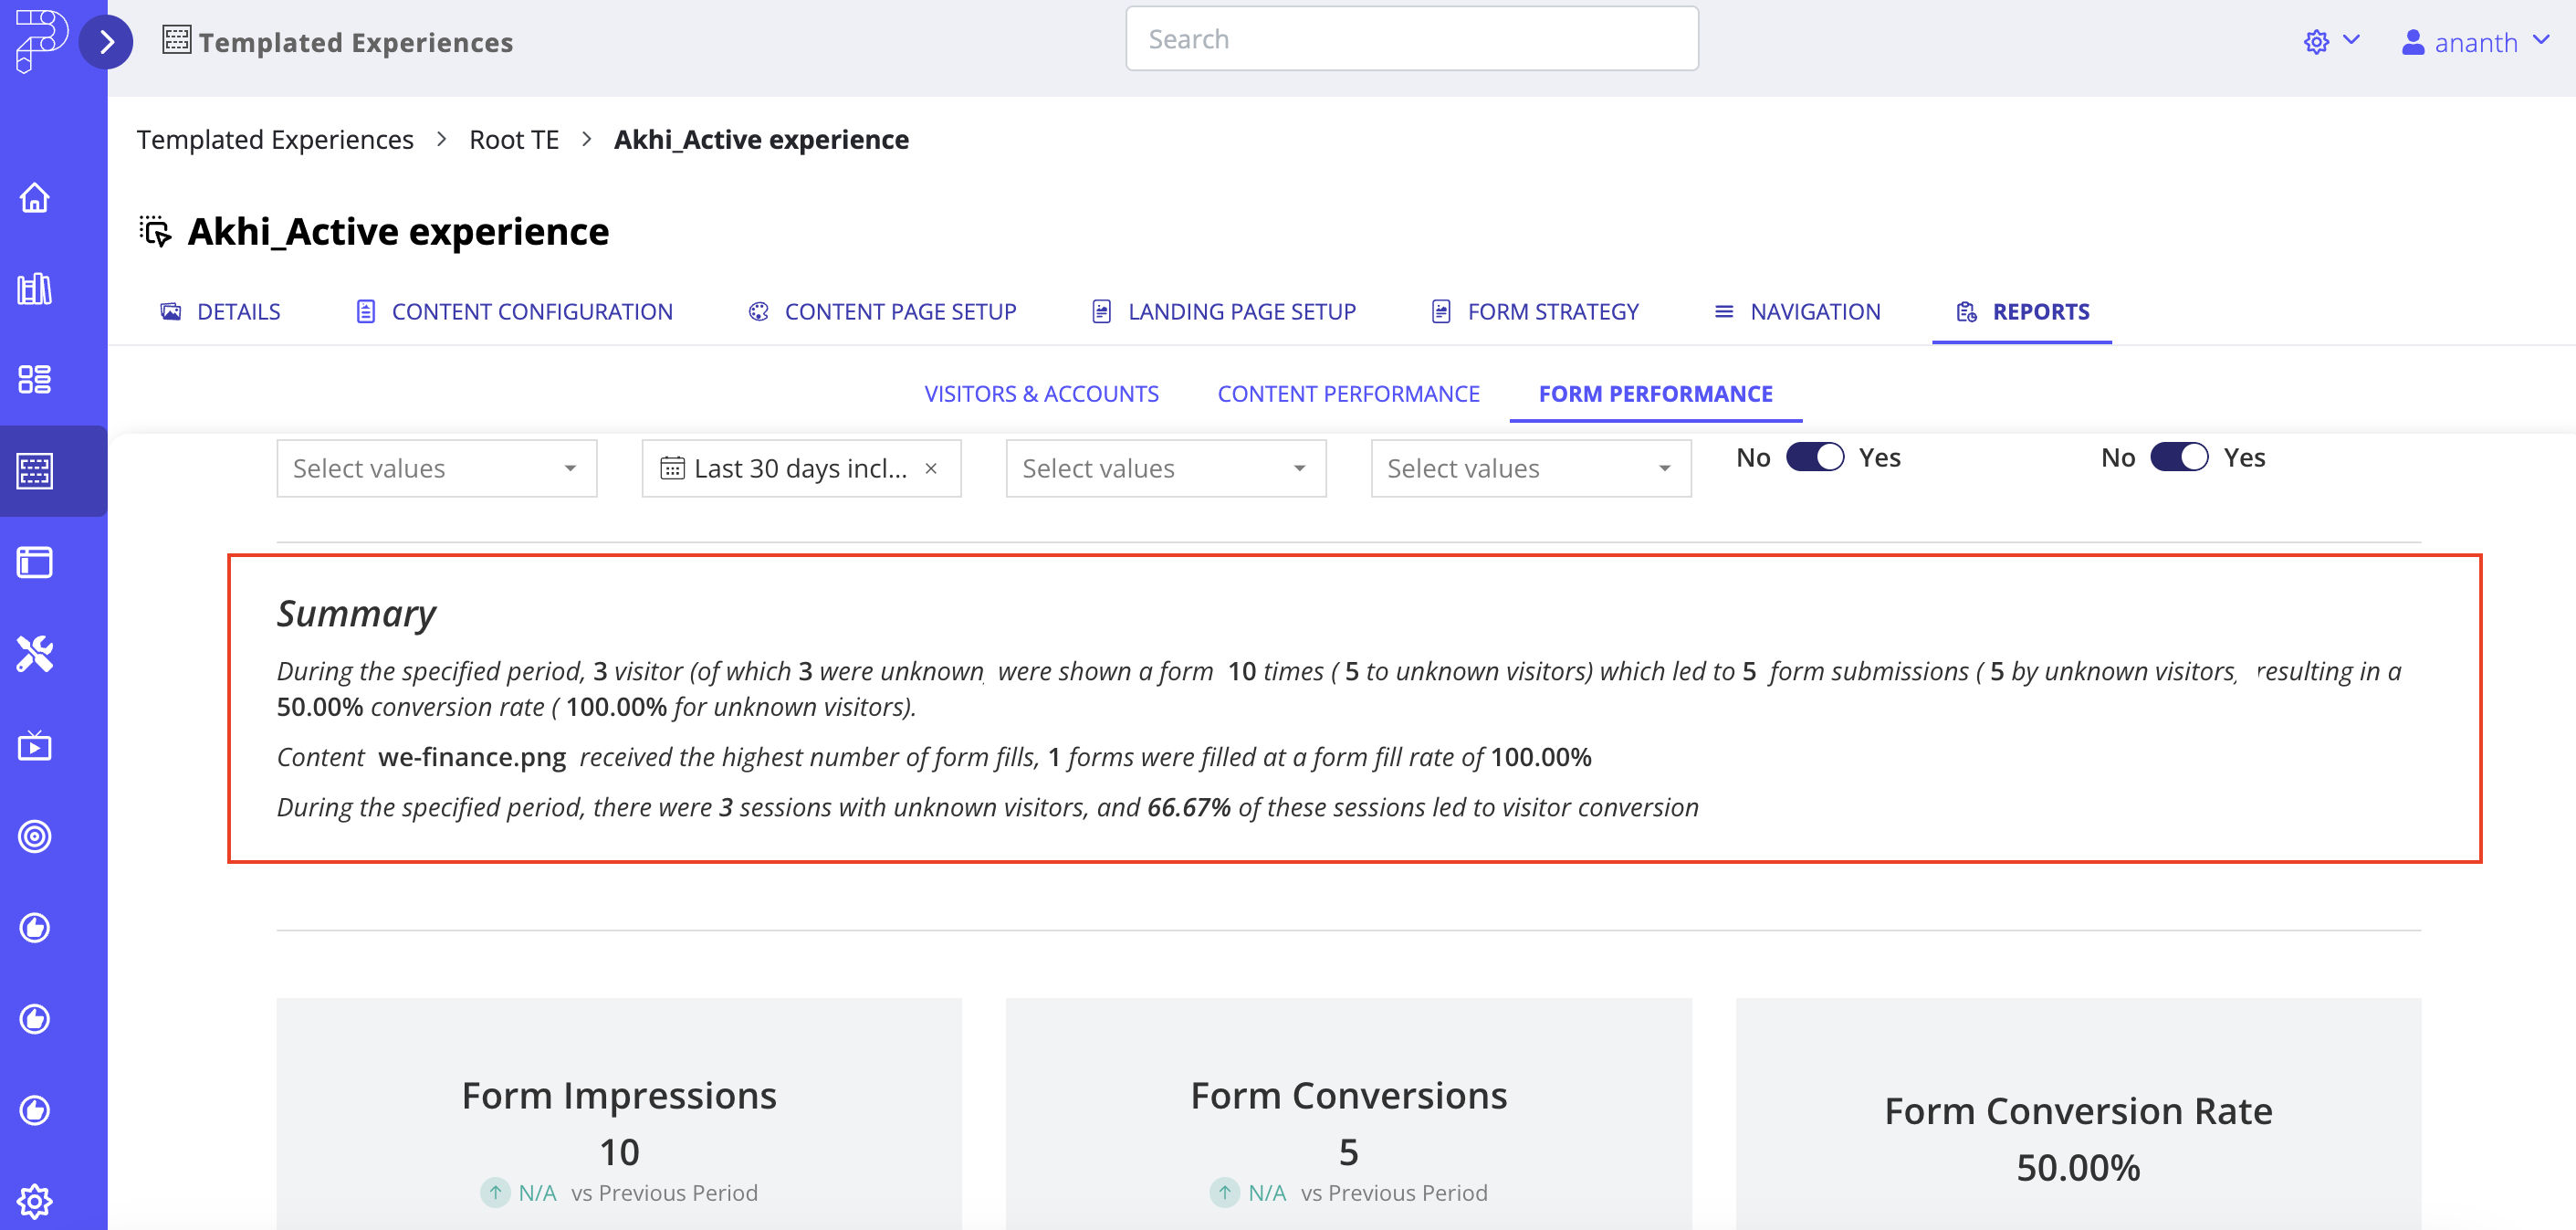 Summary example
- Number of form views: The total count of times the form has been displayed to visitors.
- Number of form completions: The total count of times visitors have successfully submitted the form.
- Conversion rate: The percentage of visitors who completed the form out of the total number of visitors who viewed the form.
- Sessions with unknown visitors: The number of sessions during the specified period where the visitor’s identity is unknown.
- Conversion rate for sessions with unknown visitors: The percentage of sessions with unknown visitors that resulted in a form submission.
- Capture rate (%): The ratio of total form completions to the total number of times the form was presented, expressed as a percentage (Total Captures / Total Forms Shown).
- Sessions by unknown visitors (M): The total number of modals that were viewed where the visitor’s identity is unknown.
- Conversion rate for sessions with form fills (%): The rate of sessions with form submissions out of all sessions by unknown visitors, expressed as a percentage (Sessions with Form Fills / Sessions by Unknown Visitors).
Views: 111