Overview
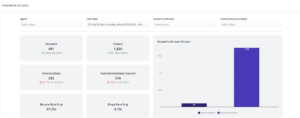
The ChatFactory Analytics Dashboard provides a centralized, interactive view of how interactions impact engagement and content consumption across accounts and visitors. It allows sales and marketing teams to monitor visitor behavior, surface high-intent accounts, and evaluate chatbot performance through detailed KPIs and drill-down paths.
Filters
At the top of the dashboard, you’ll find filters to customize your view:
- Agent – Filter metrics by specific chat agent, all are agents included by default.
- Visit Date – Set your time window for analysis.
- Account Exclusion – Select one or multiple accounts that you would like excluded from all reporting data.
- Domain Exclusion – Exclude domains to exclude accounts from the data on a broader level.

High-Level KPIs
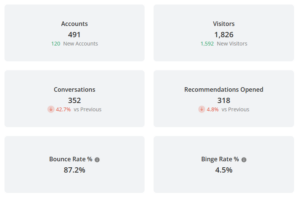
These metrics give you a quick health check of engagement over your selected date range:
- Accounts Reached: Total and new accounts that interacted.
- Visitors: Total and new visitors.
- Known vs Unknown Visitors: Breakdown by identified email address versus anonymous.
- Conversations: Total chat interactions by visitors (+% change from previous period).
- Bounce Rate: % of visitors who left without any interactions.
- Binge Rate: % of visitors who consumed multiple content assets from recommendations.
- Total Duration: Cumulative time spent chatting.
- Total View Time (Recs): Cumulative time spent with the recommended content.
- Form Fills: Total number of forms submitted.
- Experiences Created: Number of experiences generated by users.

Account Table
A detailed breakdown by company domain including:
- Conversation volume
- % change in activity
- Recommendations served
- Form submissions
- Total engagement duration
- Content view metrics
Tip: Click on any account row to open the full analytics drill-down page for that company. “Undefined” represents unknown accounts with no available reverse IP data.
Visitor Table
See granular data per visitor:
- Visitor identity
- Session timestamp
- Conversation summary (query, response, agent)
- Sentiment (emoji coded)
- Query type and top content titles
- Matching logic (relevance scores)
- Visitor source, return/new status
Tip: Unknown visitors have an encrypted ID that will reconcile all previous engagement when a user becomes known.
Recommendations Table
Tracks what content was recommended and whether it was clicked:
- Account name
- Content title & URL
- Clicked (yes/no)
- Recommendation context (chat session ID, agent)
Form Fills Table
Insight into lead conversion directly from chatbot interactions:
- Visitor identity
- Account
- Timestamp
- Form name
- Form impressions and conversions
- Associated agent/session ID
🔗 Navigation & Drill-Downs
Every table row includes live links to:
- Account analytics views
- Visitor journey views
Use Cases
- Sales: Identify which accounts are actively engaging with chatbot-driven content.
- Marketing: Evaluate campaign and content effectiveness via chatbot routes.
- CSM/Success: Monitor known visitor behavior for expansion signals.
Views: 42
