Customization is the operative word for Release M! We have added content filters so that you can more precisely view your data, create pages and presentations, and analyze your content and client base in ways that make the most sense for you and your organization.
Revenue Intelligence for PathFactory and Path Analytics both got feature boosts for viewing accounts and account data, and providing meaningful insights to see which topics are performing the best, along with indicating those topics that can do with some improvement. Navigation within Accounts has been improved as well, so you can more easily get around.
Read on to find out about the new customization available in this release!
Path Analytics
IMPROVED
Detailed reports for account performance
The Account Funnel Stage report provides an overview of account engagement to illustrate your most engaged accounts. The funnel focuses on the accounts that have simply engaged with tracks at the top and narrows in on accounts that have a larger buying committee and deeper engagement as the funnel goes down. This has been a helpful report for a lot of our customers, however in the past you weren’t able to click into the report to get the drill down of account names in the funnel stage. We have made an improvement to this report to allow you to drill down into the accounts that are engaging with content within each funnel stage for a specific list.
To access this feature, follow these steps.
- On the main menu, click Path Analytics, then select Campaign Tools, and finally click Reports.
- On the screen that appears, select Account Performance. The following screen appears.
- To view details in this report, click on any of the numbers in the image.


Improved form analytics
Form capture values are now much more accurate and consistent across all form reports. Previously, the reports across Path Analytics would have two lines per form submission showcasing different data and causing a double count. We have fixed the format of the report so that it’s an accurate depiction to the form submissions. In addition, With this dashboard you can understand the form name, the number of form captures and the capture rates. We have also added a few more data points to make your reporting and learnings even more robust. This dashboard now displays the following information:
- Indicates which assets captured forms.
- Provides a break down for each form capture to show which forms are performing.
- Provides an overview of your entire form capture rates.
VEX
NEW
VEX field merges
With the previous implementation, if you wanted to host a series of live sessions and reuse a single form that was created for a session, you would have to clone the form and enter each session name and external ID. There was no way to differentiate between the different sessions in each submission.
With these new fields available for field merges, you no longer need to copy the form. The session name and status is automatically populated at form submission. This increases efficiency and minimizes effort for each marketer.
We have added the ability to put various field names on forms as the field merges. The fields are populated when form submission takes place. Ensure these fields are available as field merge only when VEX has been toggled on.
To address this, we have created the following field merges:
{{session.name}}
{{session.description}}
{{session.type}}
{{event.external_id}}
{{event.external_id_2}}
{{event.external_id_3}}
{event.name}}
NEW
Customizable CTA button for Virtual Events
As a marketer creating a VEX session, you now have the option to add a CTA button before or after the list of supplemental content. You can also configure the CTA to be a form or a link. The form submission via the CTA click is captured as form submission and not registration.
When Enable Supplemental Content CTA is toggled on, you can:
- Select CTA as a drop-down list of all the CTAs the organization has available
- The system will auto-populate ‘Type’, ‘Destination’, and ‘Button Label’ based on the CTA that has been selected
- Set the location of CTA – before supplemental content or after supplemental content
- If you wish to override the CTA appearance you had configured in Appearance settings, you can adjust here: Select CTA button color and Select CTA font color.
Note: The CTA for supplemental content is available for the desktop experience only.
To access this feature, follow these steps.
- On the main menu, select Content Activation, and then click Virtual Events.
- From the list of events that appears, select the one you want to edit.
- When the page opens for that event, click the Sessions tab.
- For the session you want to edit, click Configure.
- You will see on the right side, below the section for Supplemental Content, a toggle button named Enable Supplemental Content CTA. Click on it to turn it on.
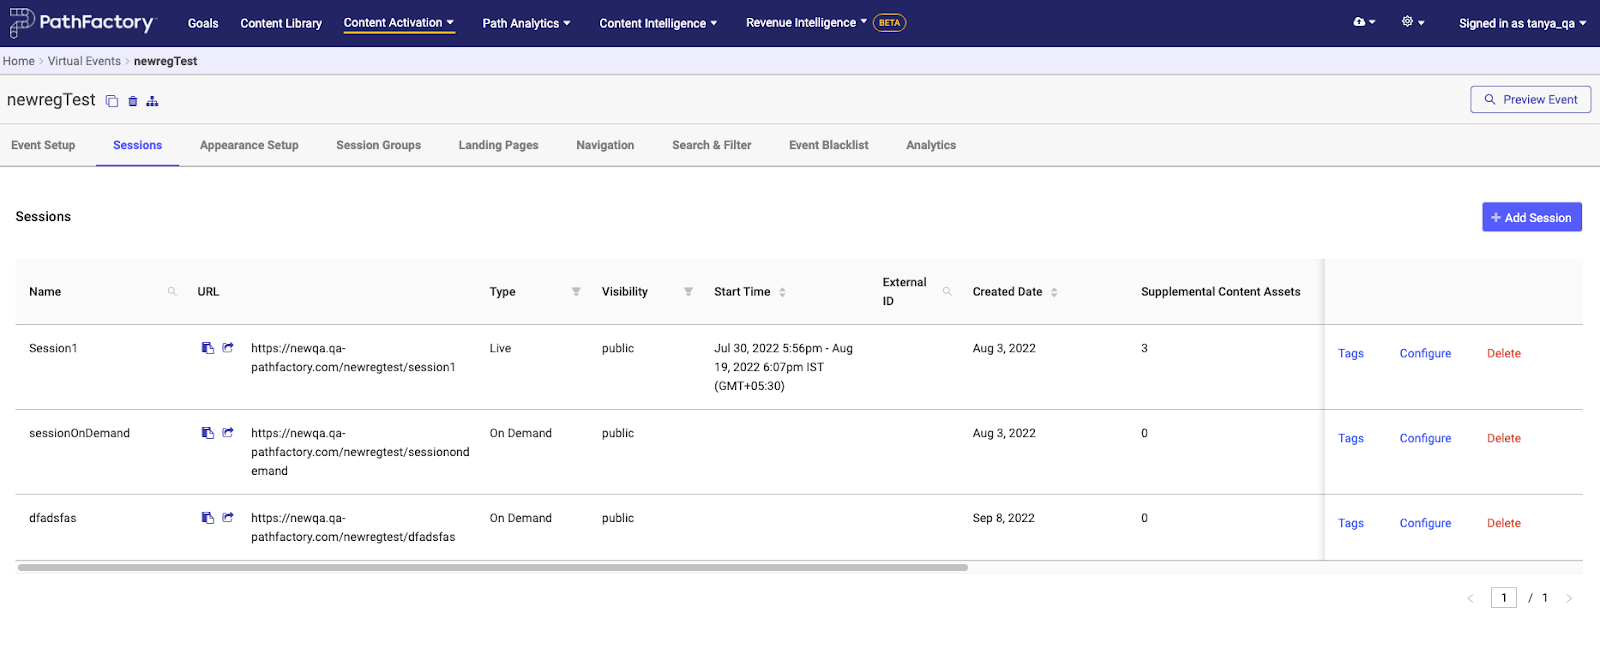

Note: You must have at least one piece of supplemental content to see this toggle.
- Scroll to the bottom of the page and click Save. The system returns a confirmation message.
Campaign tools
NEW
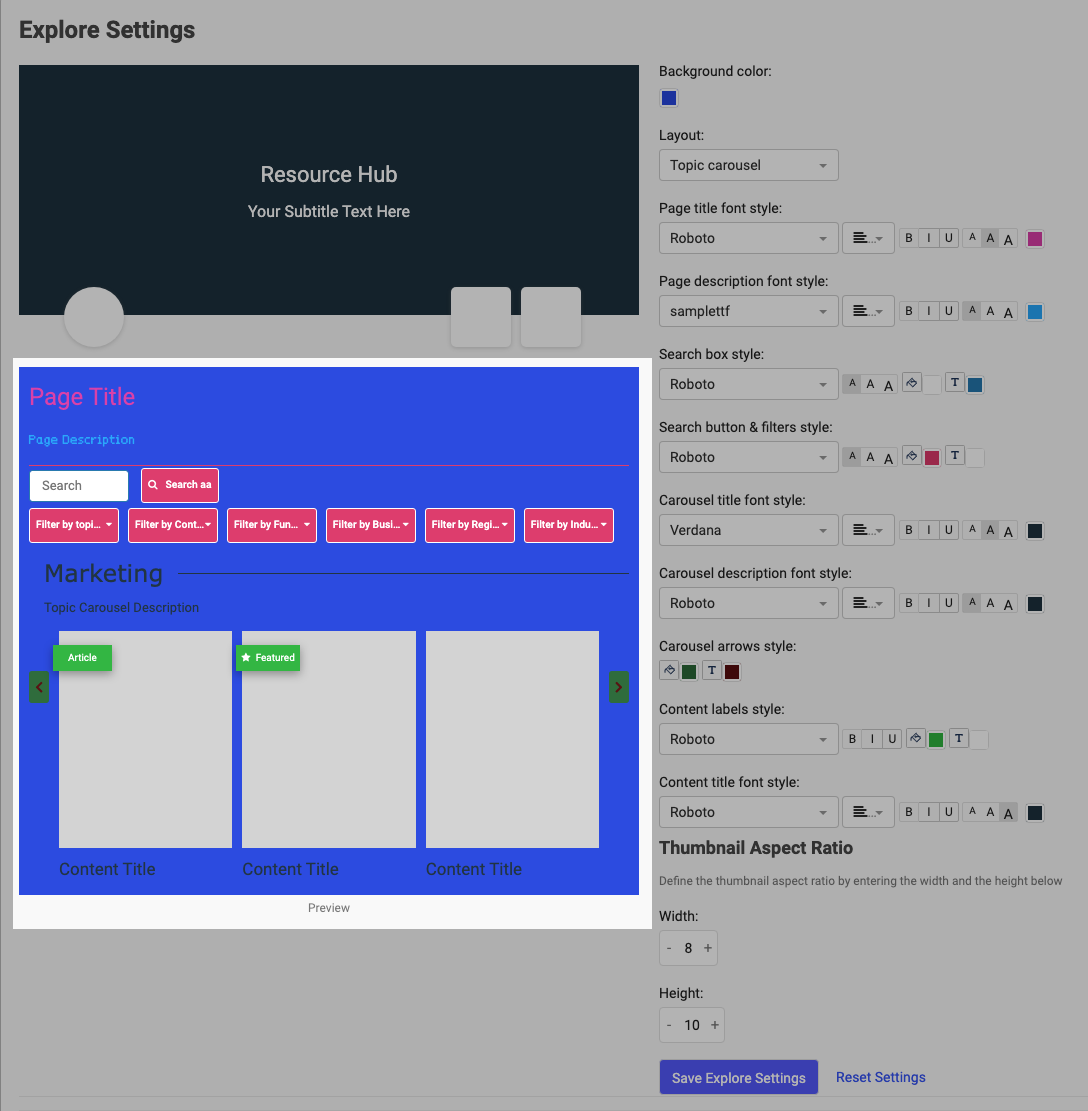
Customize appearance of topic carousel description on an Explore page
You can now configure the appearance of the topic carousel description section, including font style, font color, button color and button text color.
- Click the Gear icon on the top right and select Appearances.
- On the screen that opens, select the Campaign Tools tab, and then select Explore.
- On the screen that appears, scroll down to the Body section and for the layout select Topic Carousel.
- Here you can also edit the Carousel Title Font Style, Carousel Description Font Style, and colours, the same way you have been able to with the Page Description Font Style and other features in the appearance setting.
- On the same screen, in the Preview section, add Topic Carousel Description if desired.
- When you are finished, click Save Explore Settings or if you don’t want to save the changes, click Reset Settings.


Content library
NEW
New content tag types
We have added 2 new tags, Product and Solution to the Content Tags Configuration. Some organizations have an accessibility hierarchy that exceeds the number of content tags we offer. The addition of these 2 new tag types – Product and Solution – let you tag your content more precisely, which allows you to add a combination of filters to view what assets fall under these tags. Then you may add the appropriate assets to the experiences you are creating.
Content Tag Configuration section
To add these 2 new tags to your Content Library, follow these steps.
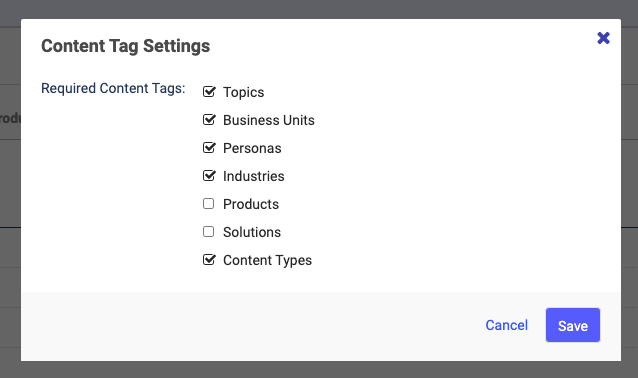
- On the main page, click on the Gear icon and select Content Tags under the General section.
- On the Content Tags Configuration screen, click on the gear icon to the right of the title.
- After you click on that gear, you see a popup menu to select tag types. Select Products and Solutions tags to activate them.
- Now when you return to the Content Tags Configuration screen, you see the new tabs. Add products to these tabs as appropriate.
- If you open the Content Library, you see the new tabs (Product and Solution) as dropdown lists, containing the products you added previously.


These 2 tags also appear as a dropdown field in the right-hand side panel (that opens up when you click on the content), within the Internal configuration section after Industry.

CSV Upload
- Product and Solution appear as 2 new columns in the CSV upload template after the Industry column.
- The Product and Solution columns appear in the CSV download.
Microsite and VEX
Open a Virtual Event or a Microsite you have created, and open the Search & Filter tab. Toggle on Search to enable and disable the tags as filters.

The filter component shows the list of all the tags that you have previously defined.
Note: If you have not defined any tags, this field is empty.
Microsite builder
- Click Content Activation, then select Campaign Tools, and finally select Microsite Builder.
- Select a Microsite you want to edit.
- Select the Search & Filter tab.
- Here you see Products and Solution available as filter options. You can enable them to appear as filters for the given block. When you are satisfied with your selections, click Save All Settings. To reset, leave the page without saving.

Field Merge
Similar to rest of the content tags, Product and Solution are now available to be used as field merge in custom forms and external code. This will help ensure these 2 tags associated with the content is automatically populated at form submission.
Syntax:
{{content.product}}
{{content.solution}}
Webhooks
Similar to rest of the content tags, you can use webhooks to pass the data associated with these 2 fields to your MAP when specific events occur in PathFactory. Product-Time Threshold Met and Solution -Time Threshold Met are now available under Visitor Acitvity and Visitor Session webhooks. The data passed via the Visitor Activity webhook will provide you with an overview of the level of engagement the visitor had with your PathFactory experience and the content assets inside them during the session. As for the visitor activity webhook, it will get triggered when a visitor to an experience has met one or more predefined activities set in the Visitor Activities configuration. In this case you will receive data on the product and solution the content asset is associated with which had its time threshold met during the session.
PathFactory for Revenue Intelligence
NEW
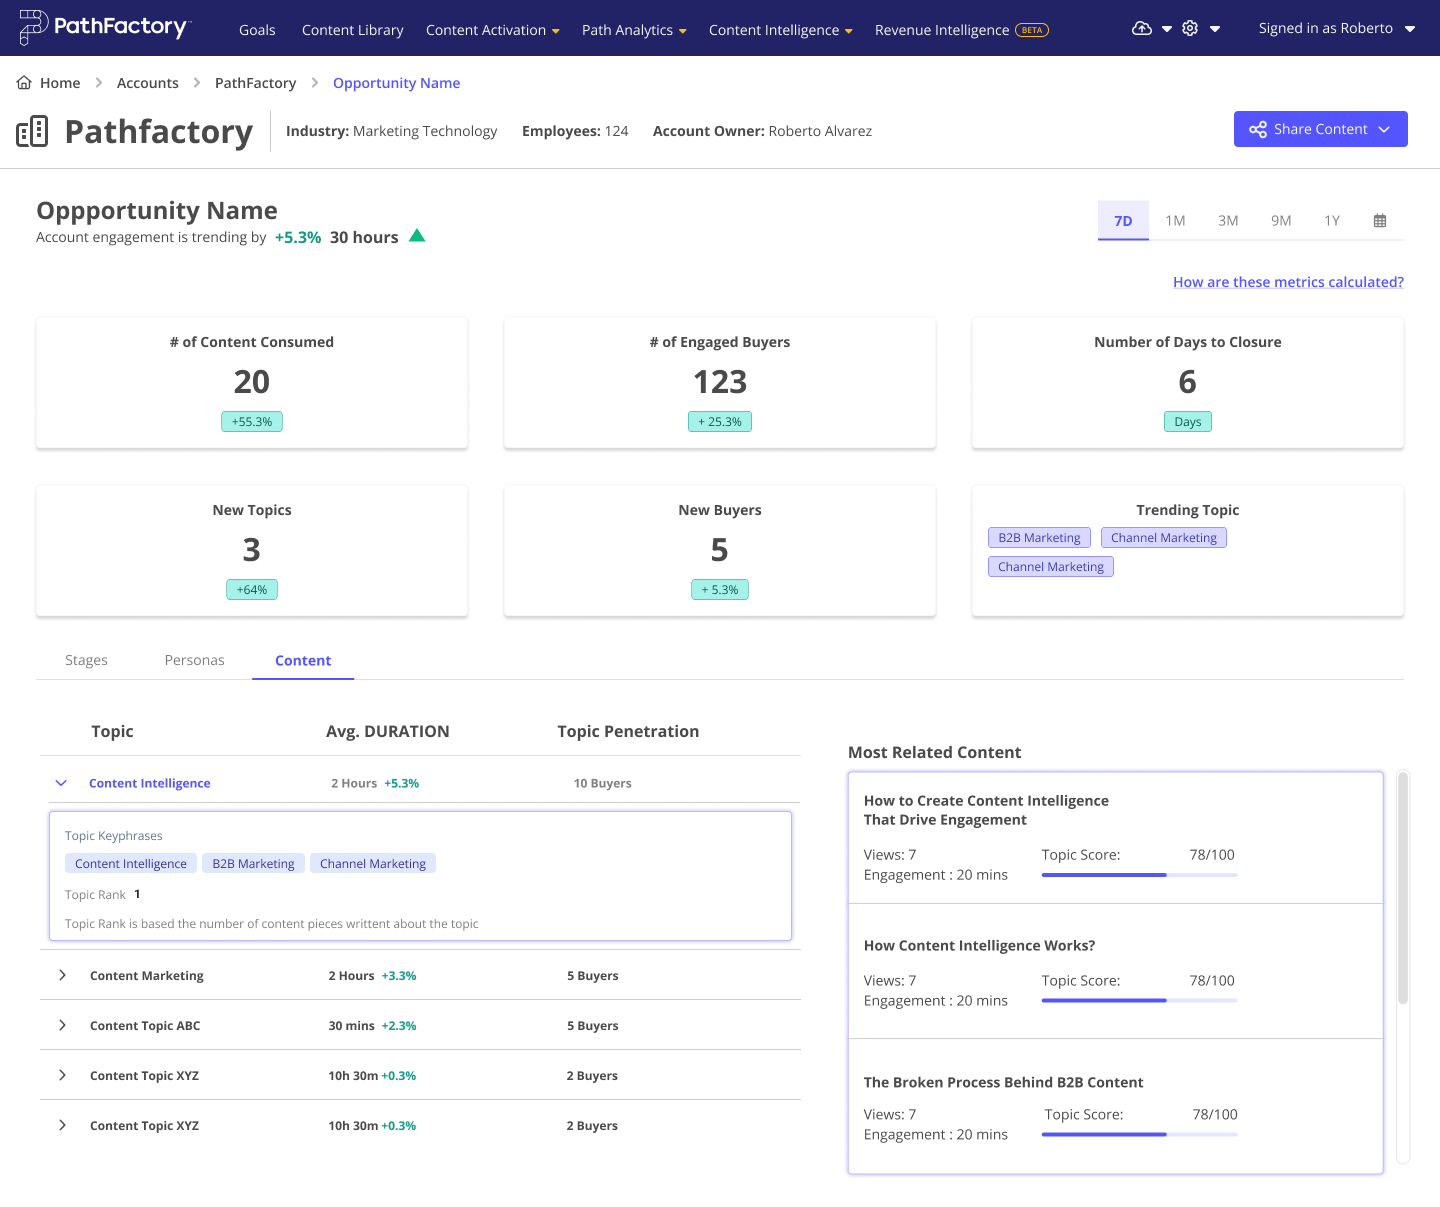
Viewing open Opportunities
Within Accounts, you can now analyze the growth of new buyers and the velocity of sales stages by seeing an overview of the opportunity metrics. This interface lets you visualize the engagement pipeline by showing you the data points and opportunity table within the account summary and active opportunity list.
- To access this dashboard, on the main menu click Revenue Intelligence, and then select Accounts.
- In the screen that opens, select the Account you wish to view.

This screen enables the salesperson to view the addition of new buyers aligning with the trajectory of engagement across the pipeline stages. Additionally, this view assesses the opportunity velocity against a baseline derived from similar opportunity types closed successfully.
NEW
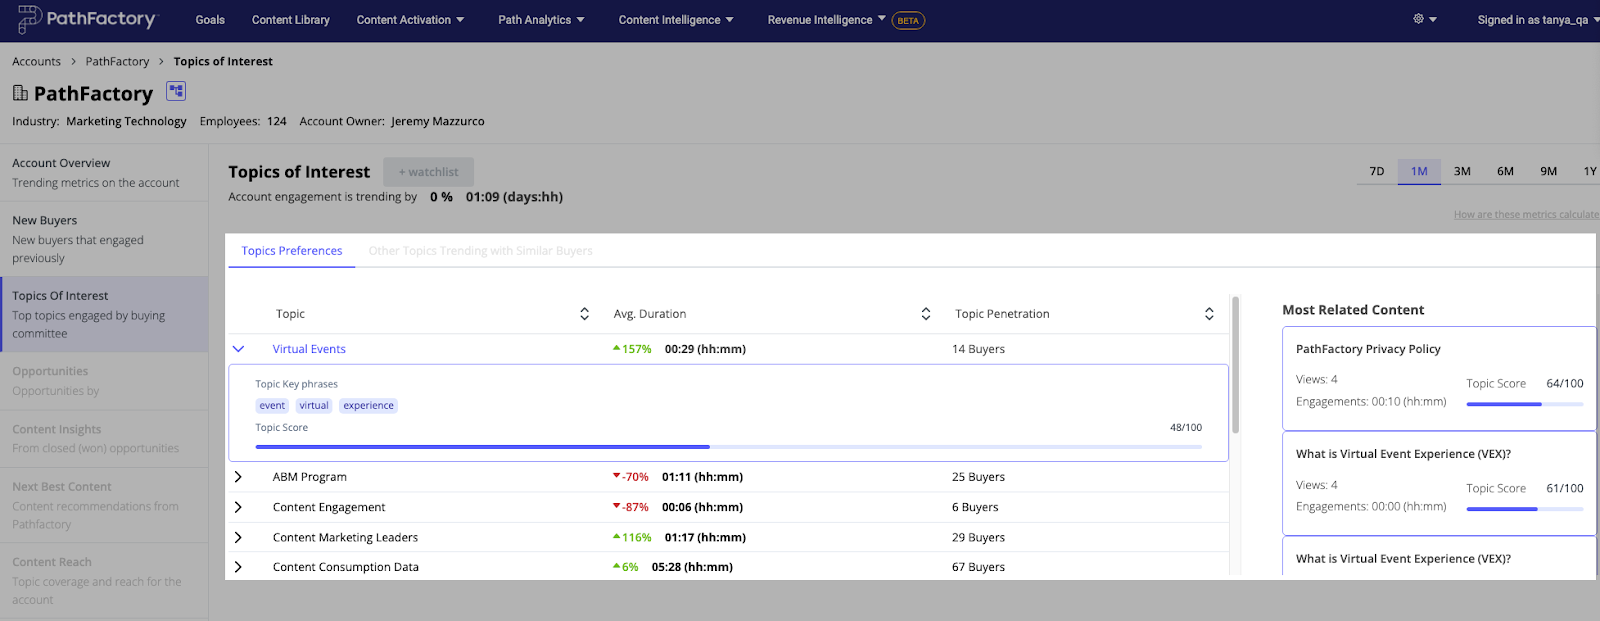
Opportunity Summary – Content tab
You can see the topics of interest associated with each opportunity, so you can analyze the topics that influence the growth of new buyers and the velocity of sales stages. To access the opportunity summary, in the Revenue Intelligence menu, click Accounts, and then select Topics of Interest on the left panel.
The topic of interest view at the opportunity level lets you see the content topics that are influencing new buyers and how they impact the velocity of sales stages.
NEW
Topics ranked instead of scored
You can see the trending of a topic so you can understand the scope (reach) of the topic in the content corpus. This is an improvement on scoring the topic, to give a clearer picture of the effectiveness of your content.
In the topic of interest dashboard under Accounts and Opportunity Overview – content tab, when you click on a topic, you see the topic rank instead of topic score.
To access this feature, follow these steps.
- On the main menu, click Revenue Intelligence and then select Accounts.
- A list of accounts appears. Select the account you are interested in.
- On the left panel, select Topics of Interest.
- Now you see a list of the most popular topics. Click on one to expand it and see more details.
- Here you can see exactly which topic is most popular, plus its related content.

IMPROVED
Active Opportunity dashboard
The Active Opportunities page lets you see the details of key metrics for all the active opportunities within the account so they can choose the opportunity they want to prioritize for engagement.
Now you have access to metrics related to engagement, buyers and topics. This information shows you opportunities that are moving towards closure so you can prioritize your activities for better conversion.
To access this dashboard select Revenue Intelligence from the main menu and then select Accounts. You will notice on the left panel you can choose different analytical views: Most Active and Active Opportunities.

The Active Opportunites screen displays opportunities that need attention by analyzing the pipeline stages that are trending in engagement.
Note: Column % change represents change in time spent during the current time period you selected, compared to previous period.
Phew! That’s a lot of new information you can gather from your Accounts! The bump up in analysis for this release will really help you determine what content is working for which accounts, and where you can improve your engagement. And to better organize your content, the new product and solution tags are here for you. Our goal here is to always improve upon your investment and help you get more insights from your data. By increasing engagement, you increase your revenue streams. Any questions? Reach out to your CSM. They are happy to help you maximize your PathFactory solution.
Views: 92