You can view several metrics about your website campaigns, to see how they are performing. See below for instructions on how to access and interpret.
Access your list of Website Campaigns
- Navigate to Website Campaigns.
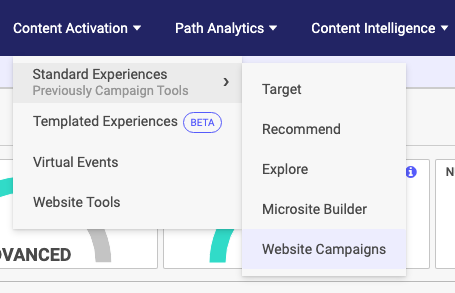
Website Campaign menu location - On the list of Website URLs that appear, you can analyze one of them or several of them at once. To view the analytics of one campaign, select the campaign and then click Analytics on the top right. To view many at once, select its corresponding checkbox, and then click Analytics.
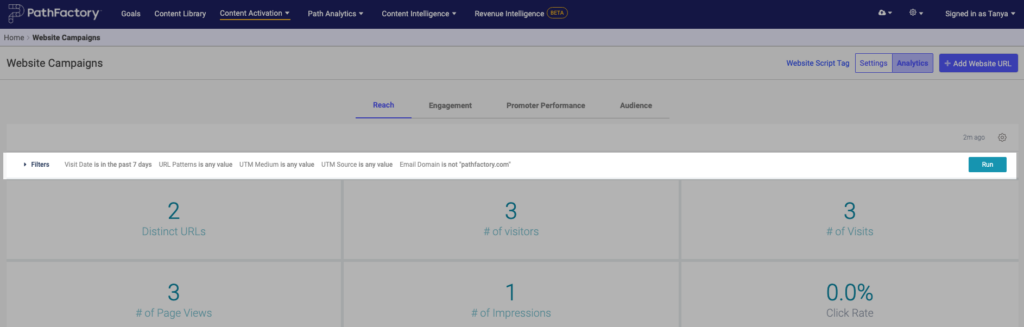
- Regardless of the number of website campaigns you have selected, you are taken to a new screen with analytic tools.
Website analytics page - For definitions of the Analytics tabs see below.
Understanding Website Campaign analytics
When you click on Analytics, you are presented with four tabs: Reach, Engagement, Promoter Performance, and Audience.
Filter your data
On the top of each tab, you see a Filter dropdown arrow. This opens a group of filters you can use to manipulate the analytic data.
You notice that the filters that are currently selected are displayed on the same line. When you expand that Filter menu, you can see the options available to drill down within your dataset.
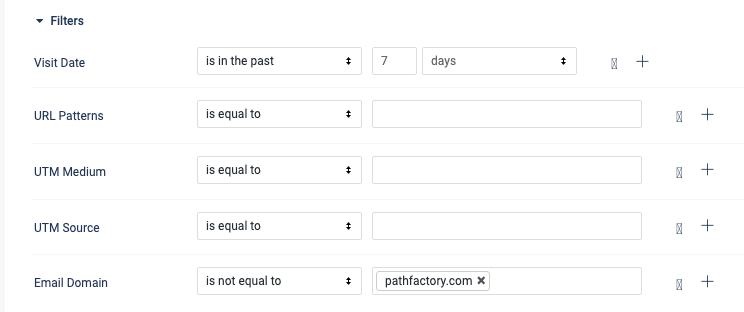
Visit Date: set the date range for your data.
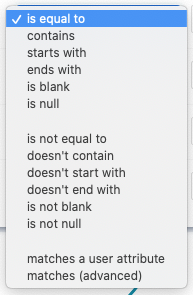
URL Patterns: Here you can include, exclude, match, and otherwise narrow down the URLs you are analyzing. Select a filter from the dropdown menu and if applicable, enter the URL in the corresponding field.
All done setting the filters? Click Run to update the analytics.
For more information on UTMs and how they work, click here and click here.
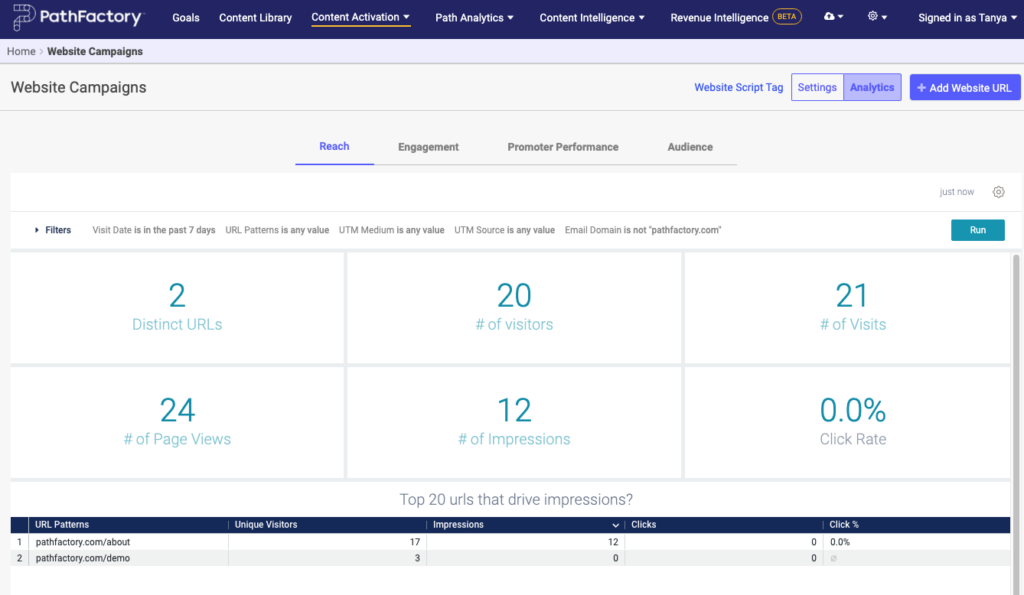
Reach tab
This dashboard provides a high-level analysis of the traffic received by your Website Campaigns. Your overall reach will show you the waterfall of your visitors and the increased engagement throughout the visit – from visit to interaction. This is your baseline dashboard that provides table stake metrics you can expect from other systems.
Specifically, the Reach dashboard helps you answer:
– What is the overall size of my audience?
– What is the content impression?
– What are the top URLs driving impressions?
- Distinct URLs – The number of unique URLs website campaigns are enabled.
- # of Visitors – Number of unique visitors who clicked your website campaigns.
- # of Visits – Number of sessions/visits on your website campaigns.
- # of Page Views – Number of page views on the assets in your website campaigns.
- # of Impressions – Number of times website campaigns were shown to visitors.
- Click Rate – A percentage representing the number of times a website campaign was clicked. This is calculated by dividing the number of clicks by the number of impressions.
Engagement
The Engagement tab displays the length of time a visitor spends with your website campaign. At the bottom of the screen you see a plain list of the promoters’ performances.
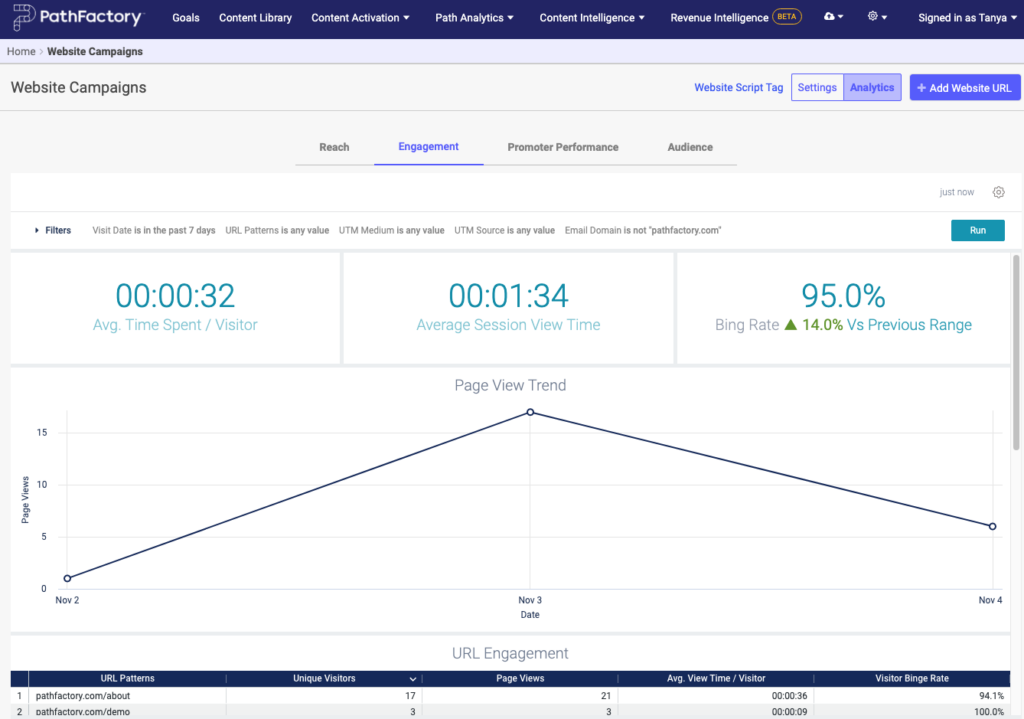
- Avg Time Spent/Visitor – Average amount of time visitors spent viewing the content of your website campaigns. This is calculated by dividing the total amount of time visitors spent viewing content by the total number of visitors.
- Average Session View Time – Average time the visitor spent viewing the content of your website campaigns. This is calculated by dividing the total amount of time visitors spent viewing content by the total number of assets viewed.
- Binge Rate – The percentage of visitors who viewed 2 assets or more in your website campaigns.
- Page View Trend – This shows how the number of page views varies over time.
Promoter Performance
This tab shows you how well your promoters are performing, plus tells you how many times the campaign has been accessed from a mobile device. This information can help influence the layout of your campaign. If you haven’t added promoters to your campaign, or added only some of them, the missing promoters are displayed as a value of zero. At the bottom of the screen you see a plain list of the promoters’ performances.
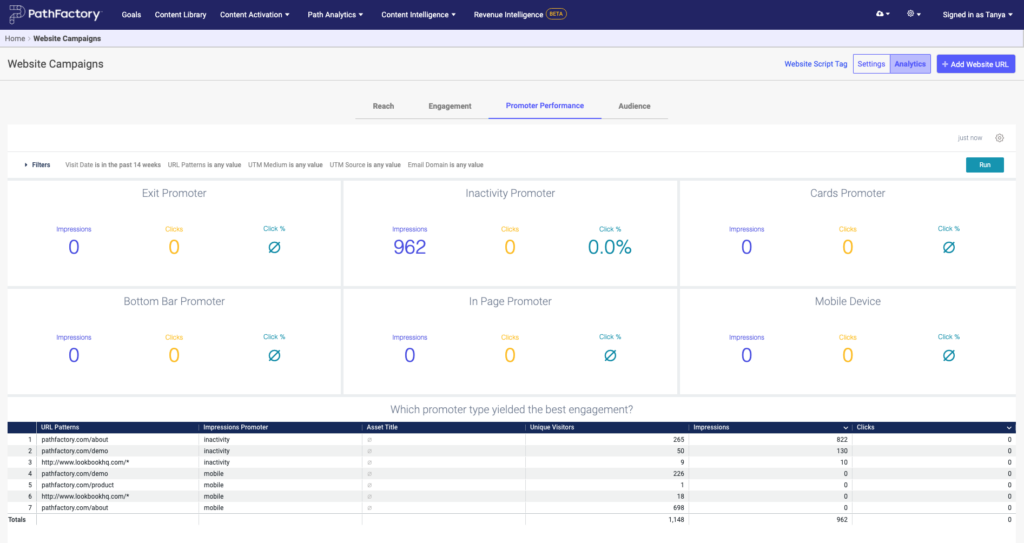
- Impressions – Number of times a specific type of website campaign was shown to visitors.
- Clicks – Overall number of clicks on a specific type of website campaign.
- Click % (Click Rate) – The percentage of visitors who clicked a specific type of website campaign after it was shown to them. This is calculated by dividing the number of clicks by the number of impressions.
Audience
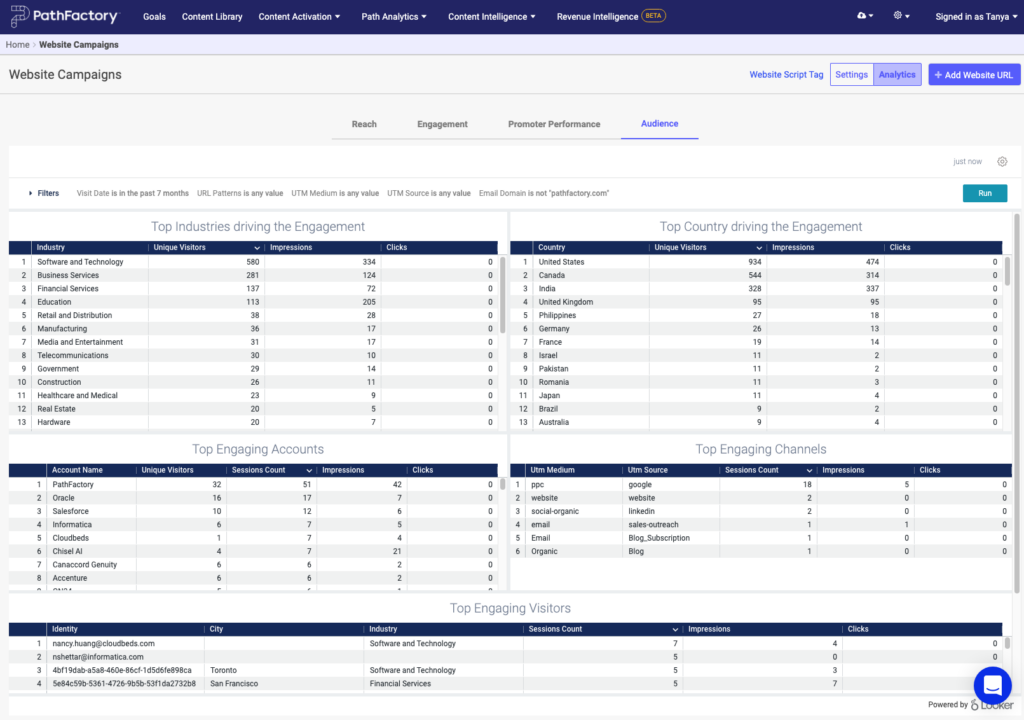
This tab breaks down performance by industry, country, accounts, channels, and visitors.