This article describes common terms and definitions that appear in Overview Reports within Path Analytics.
High-level engagement metrics
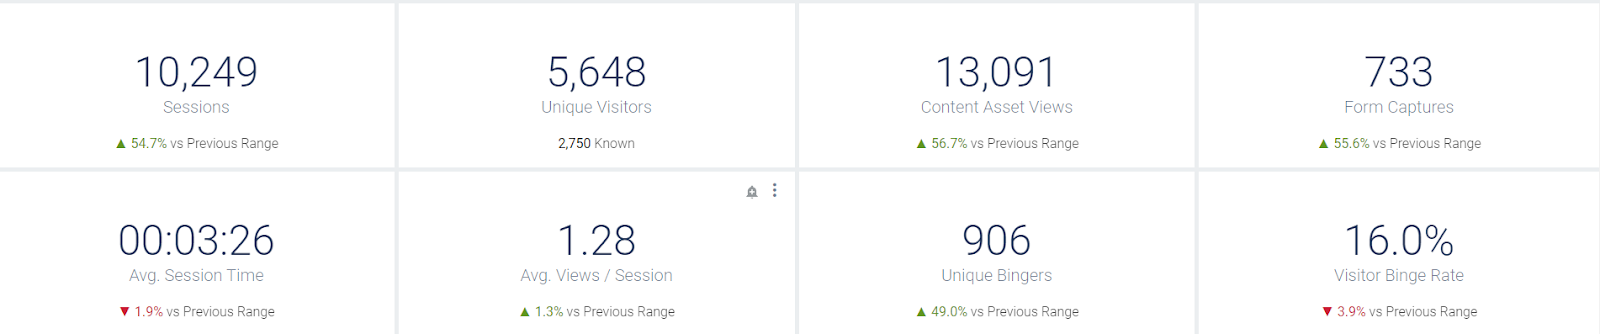
| Sessions | Refers to the total amount of times visitors have visited a track. |
| Unique Visitors | Shows how many individual visitors visited a track. |
| Content Asset Views | Refers to how many total assets were viewed by visitors over total sessions. |
| Form Captures | How many forms were captured over all sessions. |
| Avg. Session Time | Refers to the average session time over all sessions. |
| Avg. Views / Session | Shows how many assets were viewed on average per session. |
| Unique Bingers | Refers to unique visitors who viewed 2 or more assets in a track in a session. |
| Previous Range % | Indicates how metrics are trending, comparing the filtered dates to previous time frame of the same range (color coded: green for increase, red for decrease) |
Percentage of lift

| Lift in Views | Refers to the overall increase in views resulting from assets viewed beyond the first content asset in a track. |
| Lift in Engagement time | Refers to the overall increase in engagement time resulting from assets viewed beyond the first content asset in a track. |

Content Track Summary

| Track Type Name | Indicates whether the experience is a Recommend track or Target track. |
| Child Folder Name | Indicates the sub-folder/folder that the track resides in within the PathFactory instance. |
| Track (Name) | Indicates the internal name of the track. |
| Sessions | Refers to the total amount of times your audience has visited a track. |
| Avg. Session Time | Refers to the average engagement time across all sessions. |
| Unique Visitors | Shows how many individual visitors engaged with a track. |
| Unique Bingers | Refers to unique visitors who viewed 2 or more assets in a track in a session. |
| Visitor Binge Rate | Represents the % of unique visitors that viewed 2 or more assets in a track in a session. |
| Known Visitors | The number of visitors from a known audience. |
| Unknown Visitors | The number of visitors form an unknown audience. |
| Content Asset Views | Refers to how many total assets were viewed by visitors across all sessions. |
| Avg. Content Asset Views / Session | Shows how many assets were viewed on average per session. |
| Incremental Content Asset Views | Refers to the additional asset views to supplementary content, beyond the first content asset in a track. |
| Form Captures | The total number of forms filled over all sessions. |
Content Track Folders Summary

| Track Type Name | Indicates whether the experience is a Recommend track or Target track. |
| Child Folder Name | Indicates the sub-folder that the track resides in within the PathFactory instance. |
| Parent Folder Name | The primary folder under which sub-folders may be grouped. |
| Sessions | Refers to the total amount of times your audience has visited a track. |
| Avg. Session Time | Refers to the average engagement time across all sessions. |
| Unique Visitors | Shows how many individual visitors engaged with a track. |
| Unique Bingers | Refers to unique visitors who viewed 2 or more assets in a track in a session. |
| Visitor Binge Rate | Represents the % of unique visitors that viewed 2 or more assets in a track in a session. |
| Known Visitors | The number of visitors from a known audience. |
| Unknown Visitors | The number of visitors form an unknown audience. |
| Content Asset Views | Refers to how many total assets were viewed by visitors across all sessions. |
| Avg. Content Asset Views / Session | Shows how many assets were viewed on average per session. |
| Incremental Content Asset Views | Refers to the additional asset views to supplementary content, beyond the first content asset in a track. |
| Form Captures | The total number of forms filled over all sessions. |
Content Page Views

| Title | Indicates the internal name of the content. |
| View Time | Shows total view time for a piece of content. |
| Avg. View Time | Refers to the average view time of a piece of content |
| Unique Visitors | Refers to how many individual visitors viewed a piece of content |
| Page Views | Indicates the total number of asset views |

Query String Performance (Pt 1)
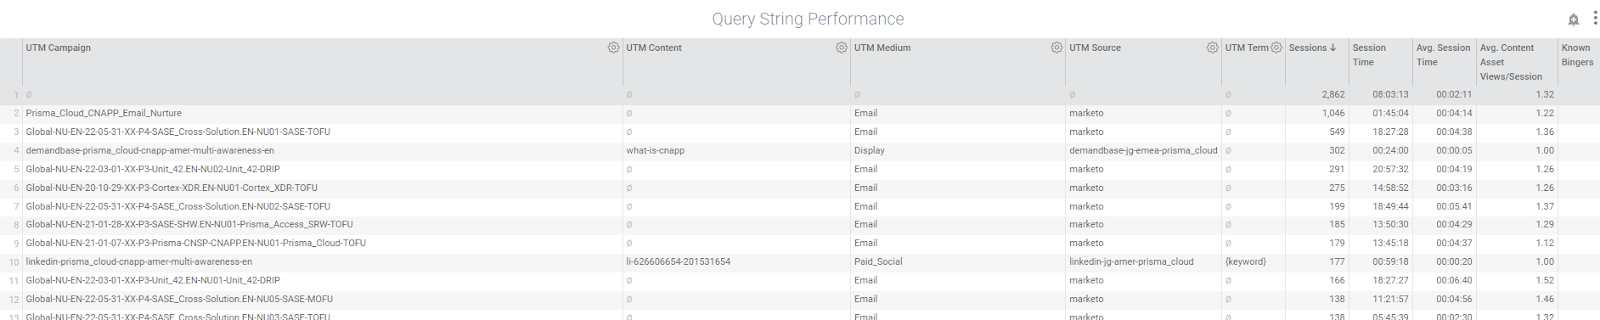
| UTM Campaign | Indicates the given query string associated with Campaign. |
| UTM Content | Indicates the given query string associated with Content. |
| UTM Medium | Indicates the given query string associated with Medium. |
| UTM Source | Indicates the given query string associated with Source. |
| UTM Term | Indicates the given query string associated with Term. |
| Sessions | Refers to the total amount of times visitors have visited from a UTM Campaign link. |
| Session Time | Shows the total amount of time spent over all sessions from a UTM Campaign link. |
| Avg. Session Time | Shows the average amount of time spent per session from a UTM Campaign link. |
| Avg. Content Asset Views/Session | Shows how many assets were viewed on average per session from a UTM Campaign link. |

Query String Performance (Pt 2)

| Known Bingers | Shows the total number of known visitors who viewed 2 or more asse |
| Known Visitors | Shows the total number of known visitors. |
| Unique Views | Shows the total number of views generated by unique visitors. |
| Unique Visitors | Shows the total number of individual visitors. |
| Unknown Visitors | Shows the total number of unknown visitors. |
| Content Asset Views | Shows the total number of asset views. |
| Visitor Binge Rate | Shows the percentage of visitors who viewed 2 or more assets. |
| Engagement Score | Indicates the total engagement score accumulated by all visitors from a UTM Campaign link. |

Views: 688