The Analytics tab for Templated Experiences, Content Playlists, and Microsites displays detailed insights into visitors and account engagement, content performance, conversion rates, form fill rates and more. This article describes how to view data, create reports, and how to share and view scheduled reports.
Note: To find out how to view analytic data for Explore Pages, read How to View Explore Page Performance Analytics.
There are three sub tabs on the Analytics tab: Visitors & Accounts, Content Performance, and Form Performance, as highlighted in the screen capture below.
Note: To navigate to this view, refer to the steps in the procedure below this screen capture.
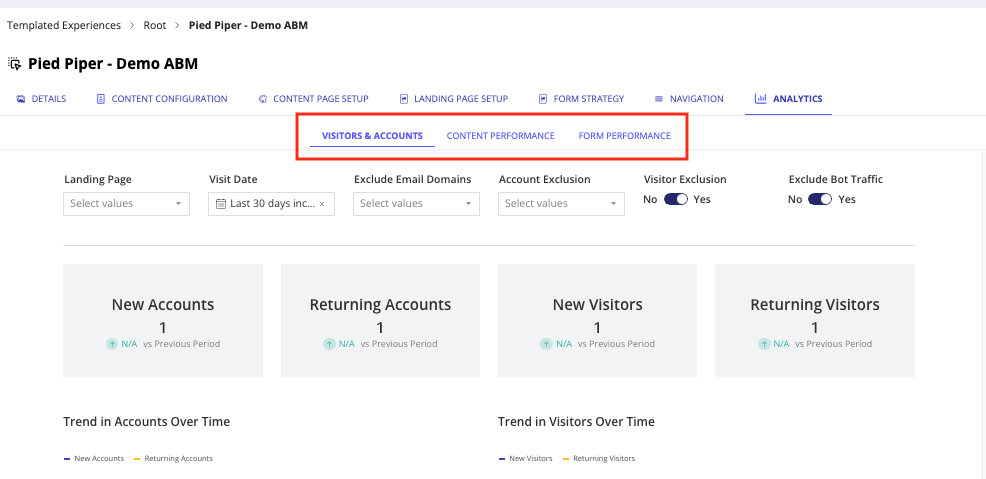
Note: You can customize the data presented on these sub tabs by using the filters provided on each of the sub tabs.
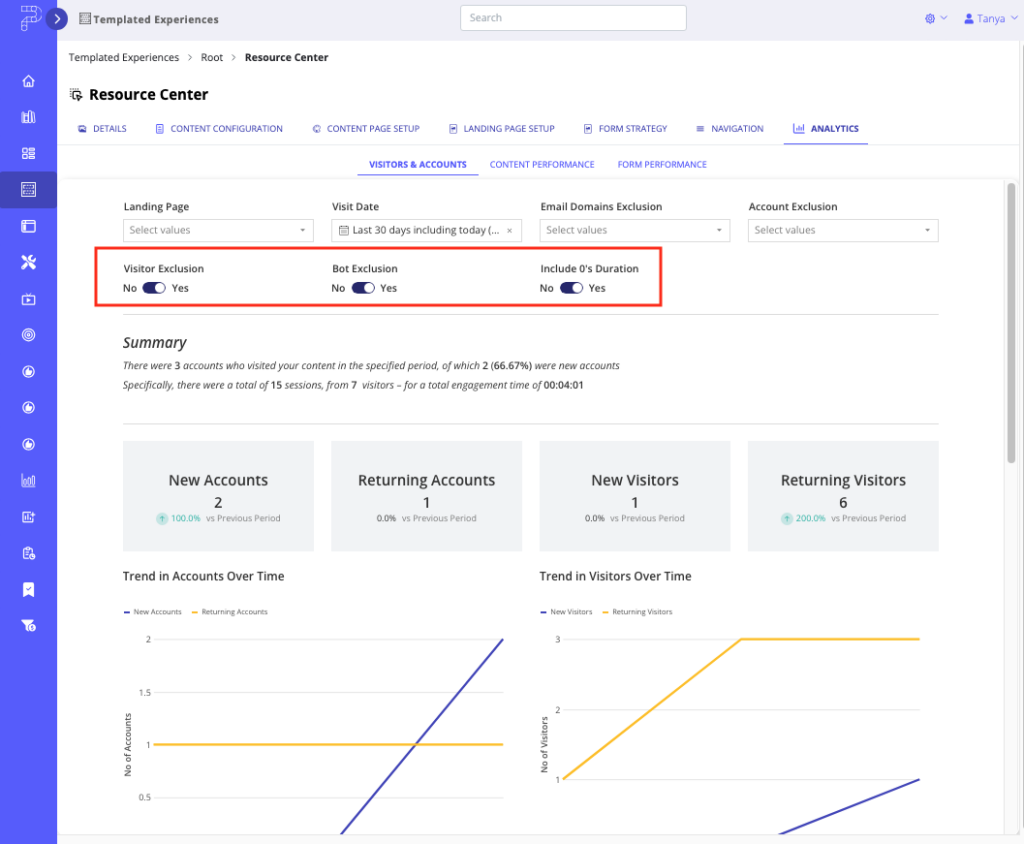
Here you can view analytic reports to see how your Experiences are performing. This reporting enables you to view engagement metrics such as total engagement time, total views, bounce rate, and more.
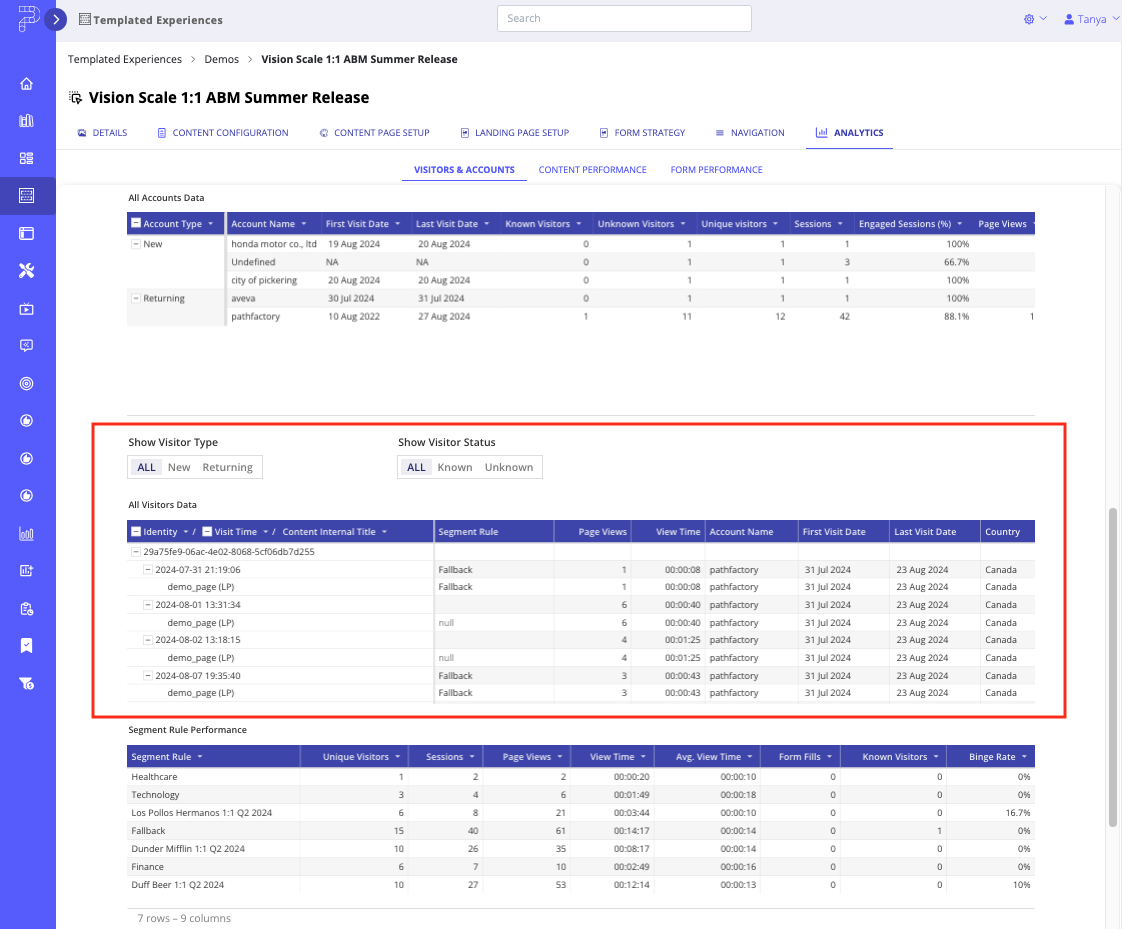
You’ll notice there are three toggles you can use to view the data in different ways.
How to Access Analytics
To navigate to the Analytics tab for Templated Experiences, Content Playlists, or Microsites, follow these steps.
- Open an Experience in edit mode.
- For Templated Experiences and Content Playlists – In the left navigation panel, expand the Content Experiences section and then select Templated Experiences or Content Playlists. From the list that appears, select a Templated Experience or Content Playlist to edit.
- For Microsites – In the left navigation panel, expand the Classic Experiences section and then select Microsites. From the list that appears, select a Microsite to edit.
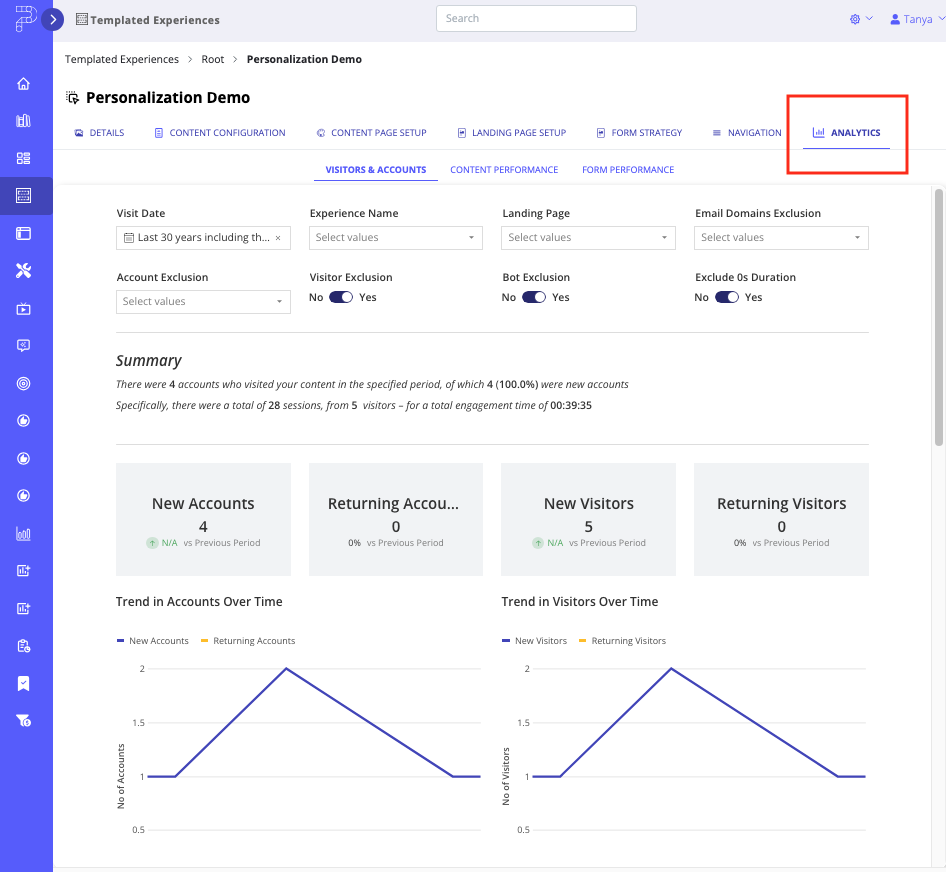
- With the Templated Experience, Content Playlist or Microsite open, select its Analytics tab, as shown in the screen capture below.
Visitors & Accounts Tab
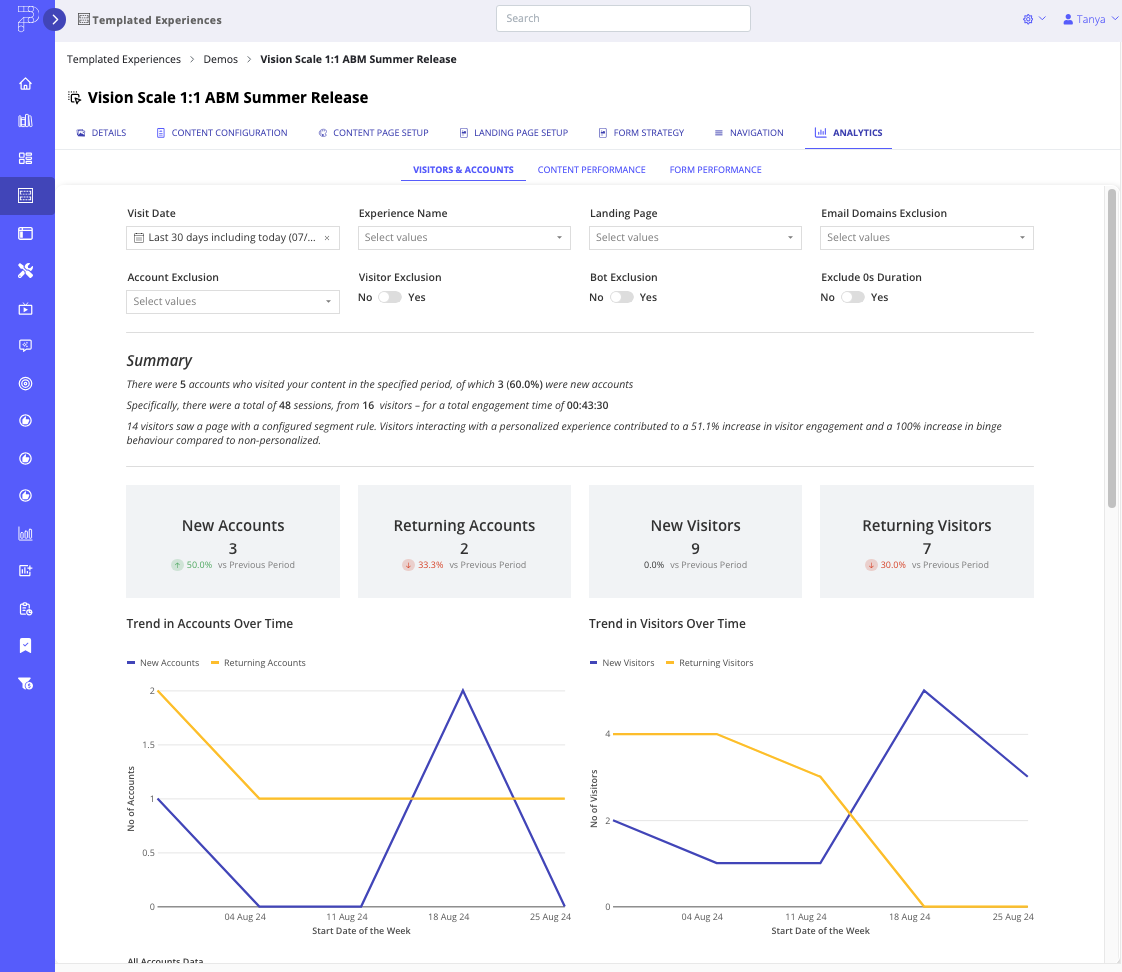
On this tab you can view engagement data specific to either a Templated Experience, a Content Playlist, or Microsite, depending on which experience type you are analyzing. The data includes key metrics such as Views, Visitors, Accounts, and Time Spent within the selected experience. The table below the screenshot provides detailed explanations for the data shown in each field, helping you understand the performance and engagement levels associated with your content.
| Metric | Description |
| Summary | This written summary provides insights into new account visits, visitor activity, engagement metrics, and the impact of personalization on visitor behavior. |
| New Accounts | This metric represents the number of accounts that accessed the experience for the first time within the selected date range. If an account’s first interaction with the Experience occurs within the chosen period, it is counted as a New Account. |
| Returning Accounts | This is the number of accounts that revisited the experience during the selected date range after having previously interacted with it. These accounts have had one or more previous sessions before the current period. |
| New Visitors | This metric shows the number of unique visitors who accessed the experience for the first time within the selected date range. If a visitor’s first interaction occurs within the reporting time period, they are considered a New Visitor. |
| Returning Visitors | This metric indicates the number of unique visitors who have previously visited the experience and returned during the selected date range. These visitors are counted as returning because they have interacted with the experience in past sessions before the current period. |
| Trend in Accounts Over Time | This graph displays the change in the number of accounts interacting with the experience over the selected period. The trend shows whether engagement is increasing, decreasing, or remaining consistent over time, helping to identify patterns or shifts in account activity. |
| Trend in Visitors Over Time | This graph illustrates the variation in the number of visitors accessing the experience over the selected period. It helps in understanding how visitor engagement evolves, highlighting peaks, drops, or stable periods in visitor interactions with the experience. |
Visitors & Accounts Data Tables
The Visitors & Accounts tab features two data tables that provide in-depth metrics into account and visitor interactions with your content. You can sort and filter the data on screen or export for further analysis or use with other data sources.
All Accounts Data Table
This table provides a detailed overview of how different accounts interact with your content over time. The table includes essential metrics such as Segment Rules, Account Type (new or returning), Account Name, First Visit Date, Last Visit Date, and the number of Known Visitors, Unknown Visitors, and Unique Visitors. Additionally, it offers insights into account engagement through Engaged Sessions (%).
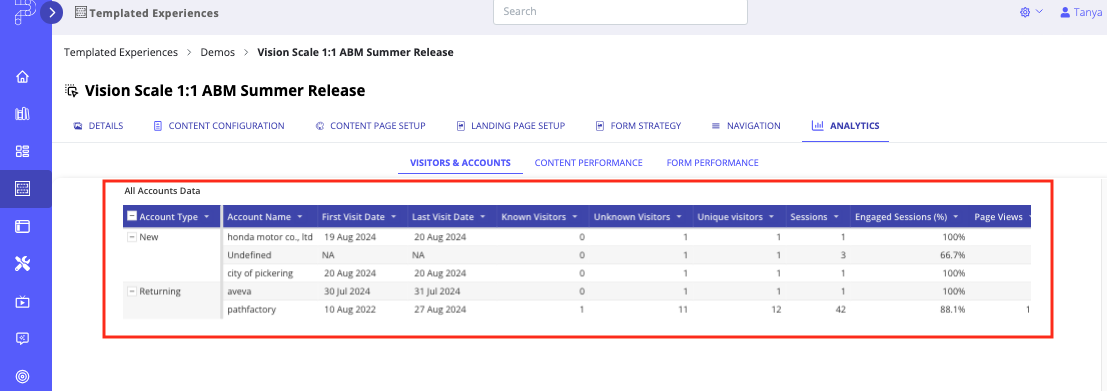
You can analyze this data from different perspectives by sorting the columns. For example, you can sort by Account Type to distinguish between new and returning accounts, or by Engaged Sessions (%) to identify which accounts show the highest levels of engagement. This sorting capability allows you to gain valuable insights into account behaviors, helping you refine your engagement strategies.
All Visitors Data Table
This table offers a comprehensive view of individual visitor journeys and the specific content visitors have engaged with. The Content Internal Title column displays the titles of the content assets viewed by each visitor and a detailed view of their interactions
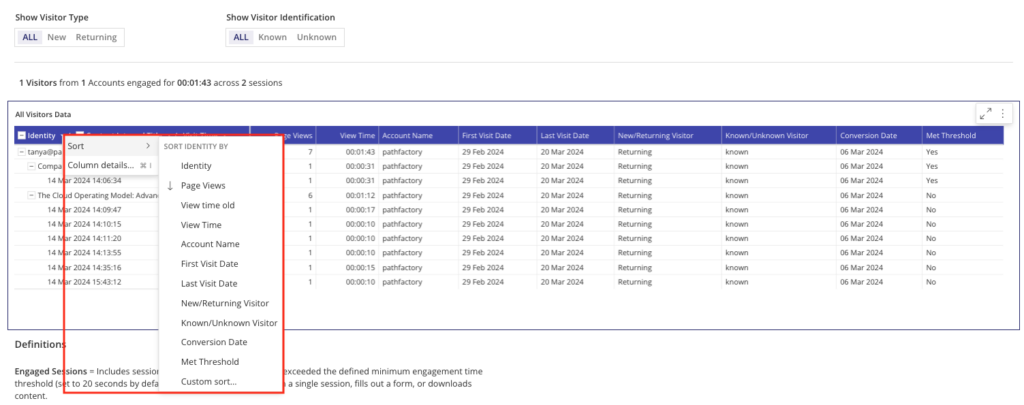
To sort the columns, click the down arrow on a table column within the header row. You may sort the Identity, Content Internal Title and Visit Time columns to view the table from different perspectives. Below is an example of the Identity column sorting options.
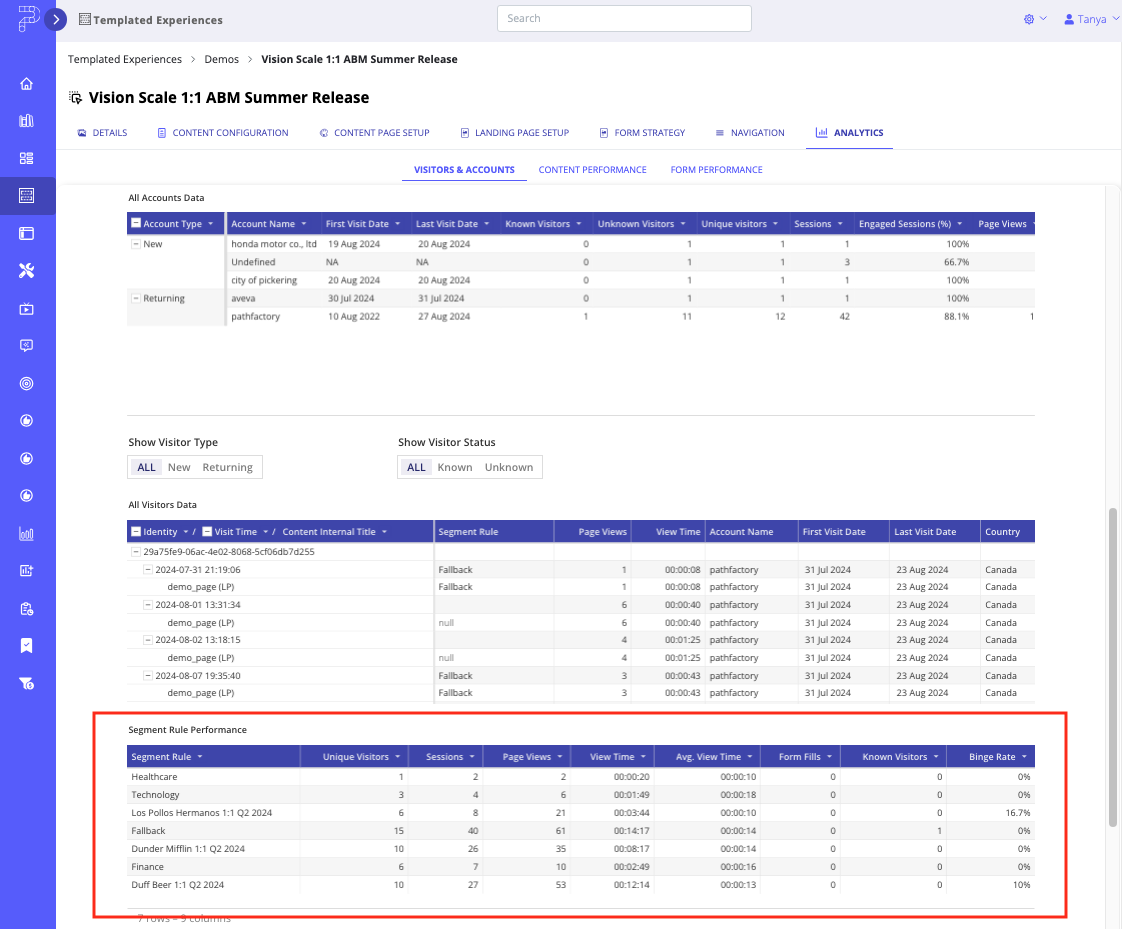
Segment Rules Performance Data Table
The Segment Rule Performance Data Table provides a detailed view of how different segment rules are performing within your Templated Experience or Content Playlist. This table enables you to see which segments are most effectively driving engagement and conversions, offering insights into the effectiveness of your audience targeting and engagement strategies. The data includes metrics such as Segment Name, Rule Type, Total Sessions, Engaged Sessions (%), Conversion Rate (%), and Average Time Spent. By analyzing this information, you can identify which segment rules are most successful and which may require adjustment to better align with your overall engagement goals.
Content Performance Tab
The Content Performance tab enables you to evaluate how your content is performing across various metrics and channels. Use chart metrics like Page Views, Average Engagement Time, Total Accounts, New Accounts, Total Visitors, New Visitors, or Returning Visitors to understand audience engagement patterns and content performance trends.

| Metric | Description |
| Summary | An overview of visitor behavior, engagement levels, and content performance |
| Chart Metrics | From this dropdown list, select a metric to gain insights into different aspects of your content’s impact. This list contains options such as Page Views, Average Engagement Time, Total Accounts, New Accounts, Total Visitors, New Visitors, or Returning Visitors. |
| Page Views for Landing Pages and Content | This metric helps you identify which Landing Pages and content assets are drawing the most attention, allowing you to focus on optimizing high-traffic areas for better engagement and conversions. |
| Trend in Landing Pages Performance Over Time | This metric enables you to view the performance of your Landing Pages over time, to identify trends and patterns. By observing these trends, you can determine whether your content strategies are improving, staying consistent, or needing adjustments. |
| Unknown Visitors | These are visitors who do not have an email address associated with their engagement data. The visitors may or may not be associated with an account but their individual details are still unknown (name, title, email, etc.). For unknown visitors, PathFactory collects their data under a unique cookie based identifier to reconcile their previously recorded engagement data under the de-anonymized profile when it becomes available. |
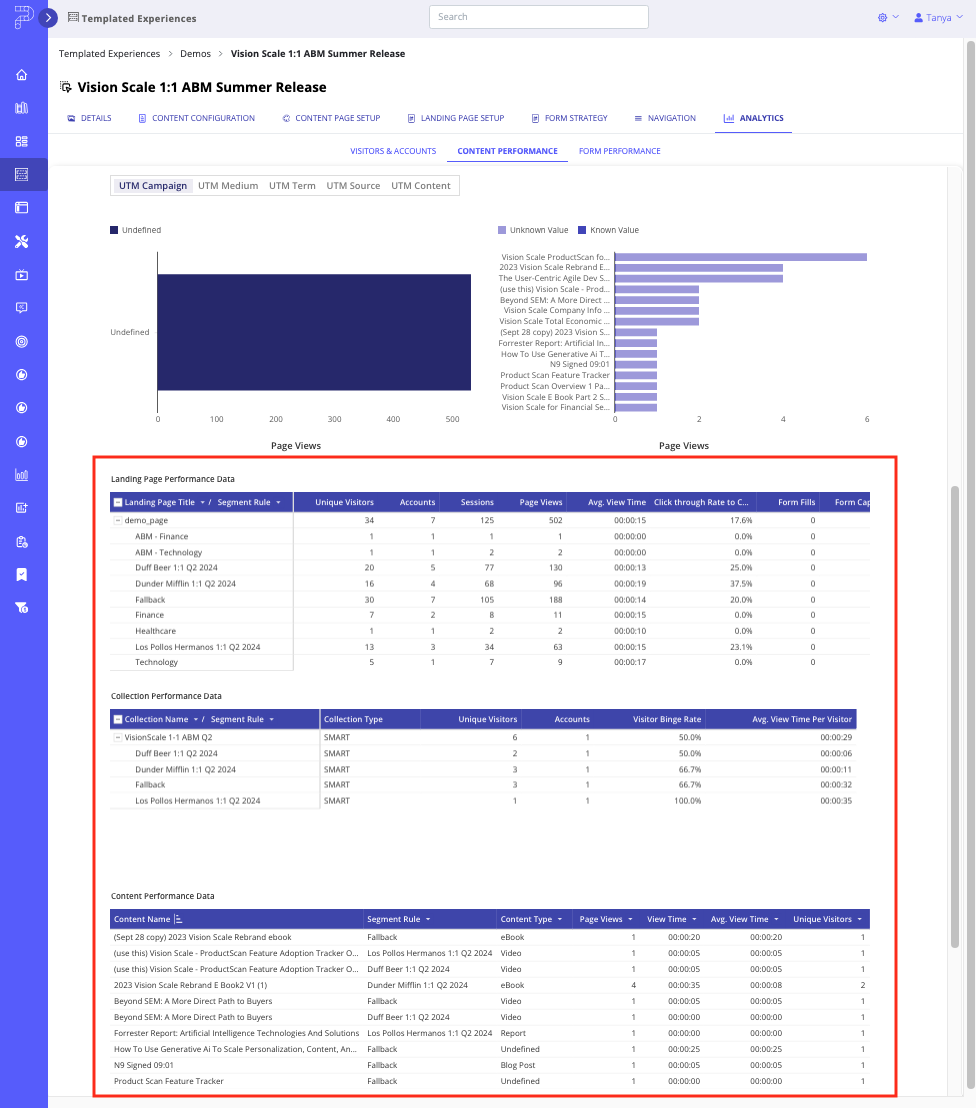
Content Performance Data Tables
Below the main dashboard views on the Content Performance Tab, you’ll see three data tables:
- Landing Page Performance Data – This table provides detailed data metrics for each Landing Page by title, providing a snapshot of Unique Visitors, Accounts, Sessions, Page Views, Avg. View Time, Click-Through Rate to Conversion (%), Form Fills, Form Capture Rate, and the percentage of Engaged Sessions.
- Collection Performance Data – Here, Collections are listed by title, along with their Type, Visitor Count, Account Activity, Visitor Binge Rate, and Average View Time per Visitor.
- Content Performance Data – This table lists content assets by their internal title, offering a breakdown by Content Type, Trend, Unique Visitors, Accounts, Sessions, Page Views, Average View Time, Form Fills, Form Capture Rate (%), Content Binge Rate (%), and Cohort Name. Cohort analysis helps you understand user behavior at a deeper level, revealing patterns that might not be apparent when you view overall data.
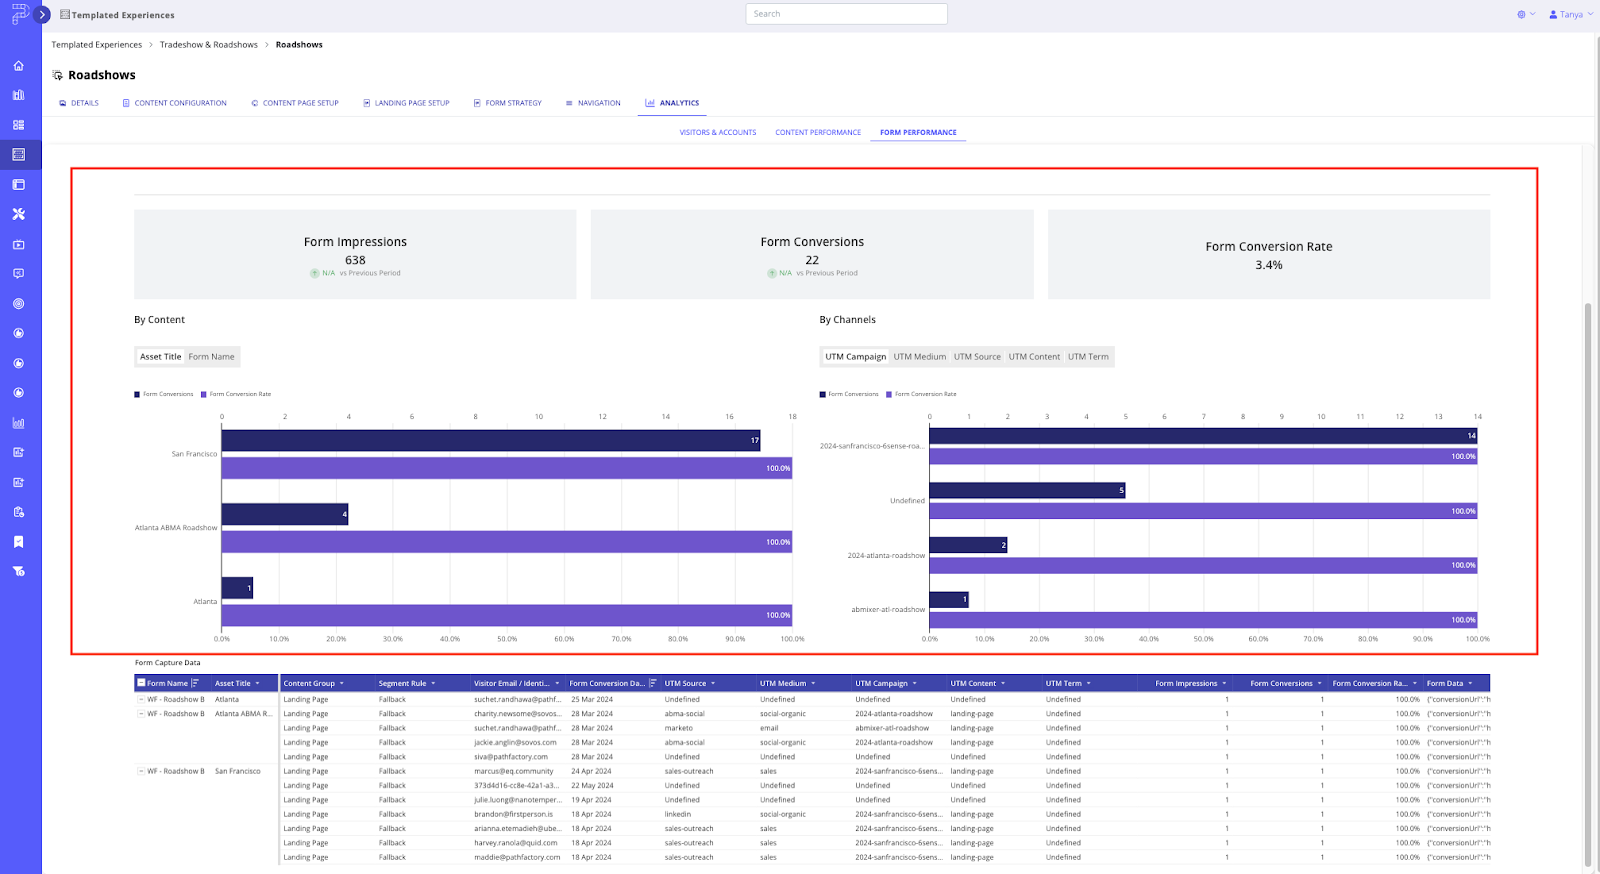
Form Performance Tab
On this sub tab you see top performing forms for Content, Topics, and Channels for the Templated Experience or Content Playlist. Below the screen capture read on to find out what data is being shown here.
| Metric | Description |
| Summary | This is a written overview of form interactions and visitor conversions during the specified period. |
| Form Impressions | This is the number of times a form is viewed by visitors. This metric tracks how often the form appears on a user’s screen, indicating its reach and potential visibility to your audience. |
| Form Conversions | This is the count of visitors who complete and submit a form successfully. This metric is crucial for measuring the effectiveness of your forms in capturing user information or achieving its intended purpose, such as signing up for a newsletter or registering for an event. |
| Form Conversion Rate | This is the percentage of form impressions that result in a conversion. This rate is calculated by dividing the number of form conversions by the total number of form impressions, then multiplying by 100. It is a key indicator of the form’s effectiveness in turning viewers into participants or customers. |
| By Content | This graph provides a visual analysis of which content assets generate the most form impressions and conversions. |
| By Channels | This graph displays which sources, media, or campaigns are most effective at generating form views and conversions. |
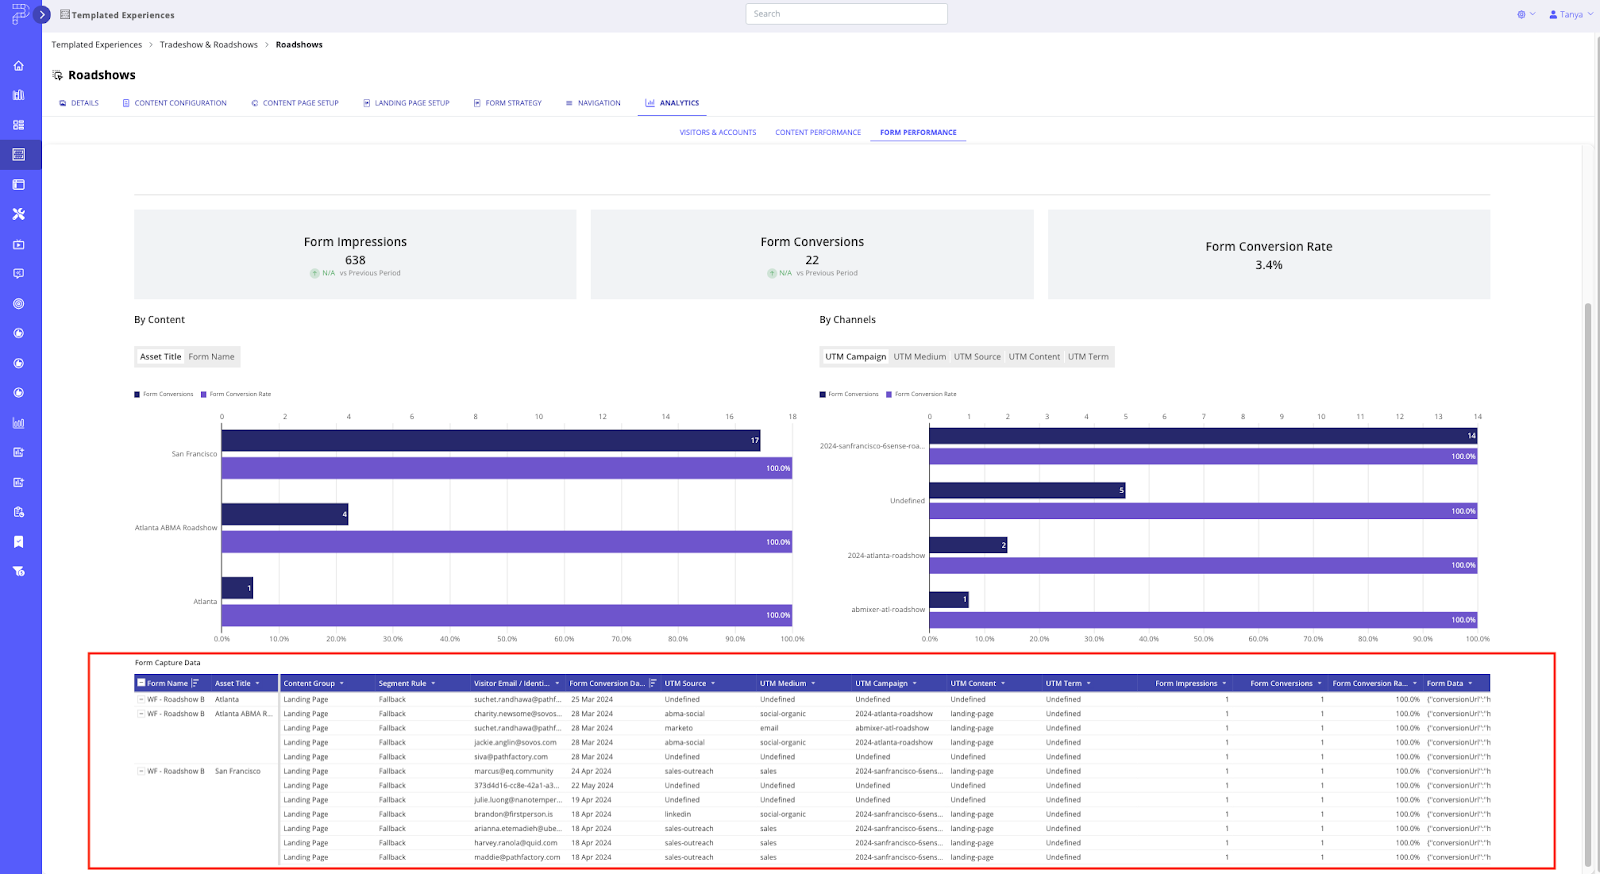
Form Capture Data Table
The Form Capture Data table includes information on form identifiers, user engagement, content specifics, and campaign effectiveness through UTM parameters. This dataset not only measures the success of each form via conversion rates but also allows for an analysis of traffic sources and user behavior over time.
Note: These views are dependent on marketers proper use of UTM parameters in the URLs they use to activate and promote PathFactory experiences. If you need guidance on how to properly use UTMs, please contact your Customer Success Manager for support.
How to Download and Share Analytic Reports
To access report viewing options, hover over any data element. Two icons will appear: a table and three dots.
- Table Icon: Click this icon to view the underlying data table for the selected data element.
- Three Dots Icon: Click this icon to open the Reports Sharing Menu, which provides options to export data, set up alerts, and more.
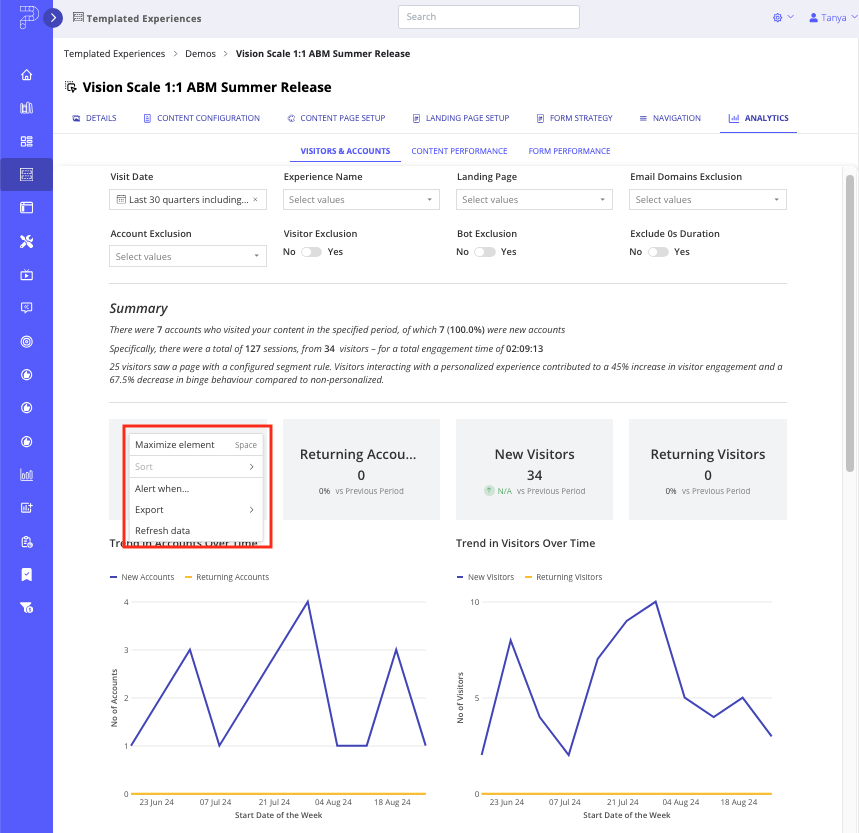
Reports Sharing Menu
This Reports Sharing menu contains the following options:
- Maximize element – Use this option to get a closer look at a single data element. A popup menu appears and the data element appears magnified.
- Alert When… – Use this option to schedule data exports based on specific conditions. In the pop-up window, you can configure the criteria for the alert, select recipients, attach files, and set other preferences.
- Export – Click this option to save the selected data set to a file, configure default download settings, or schedule a report for future export.
- Refresh Data – This option allows you to rerun the report with the filters you have already set.
How to Export Data to a Scheduled Report
Within the Export menu, you’ll find two key options: Export and Schedule Reports.
How to Export a Data Report Immediately
Follow these steps to immediately download the selected data set.
- Select the Export option as shown in the screen capture below.
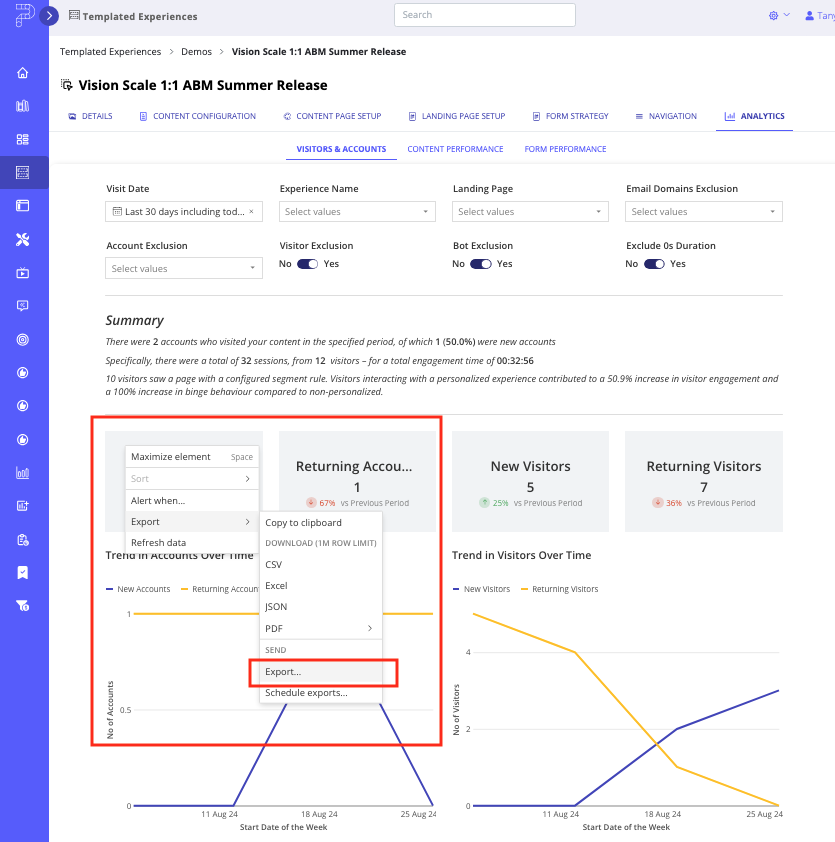
- Specify the file format (PDF, PNG, or CSV), the delivery method (Download, Email, Webhook, or Cloud Storage), and any desired attachments.
The menu will update dynamically based on your selections.
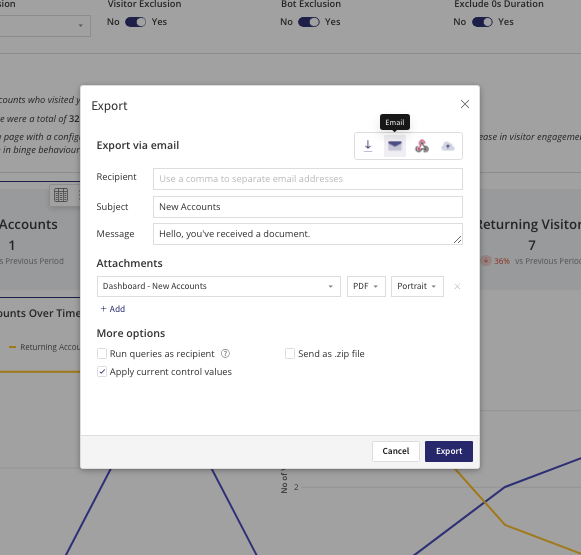
- When you have finished setting up the report’s format and delivery method, click Export to proceed. To exit without exporting, click Cancel.
How to Schedule a Data Report Export
Select this option to schedule a report export.
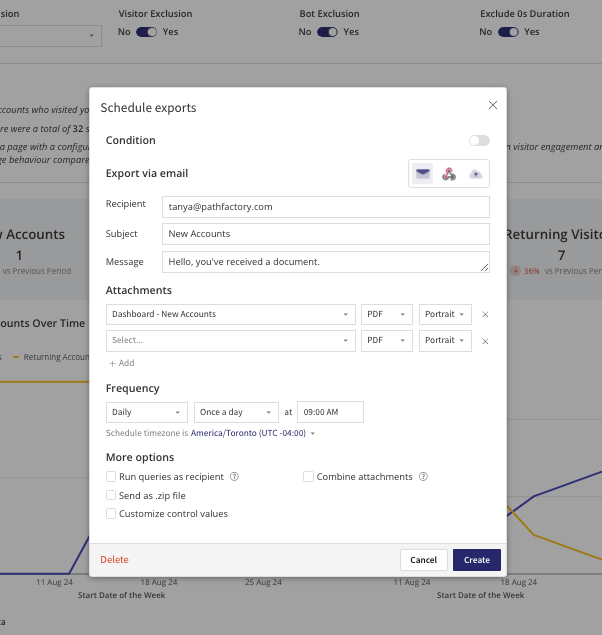
- Select Schedule exports as shown in the screen capture below.
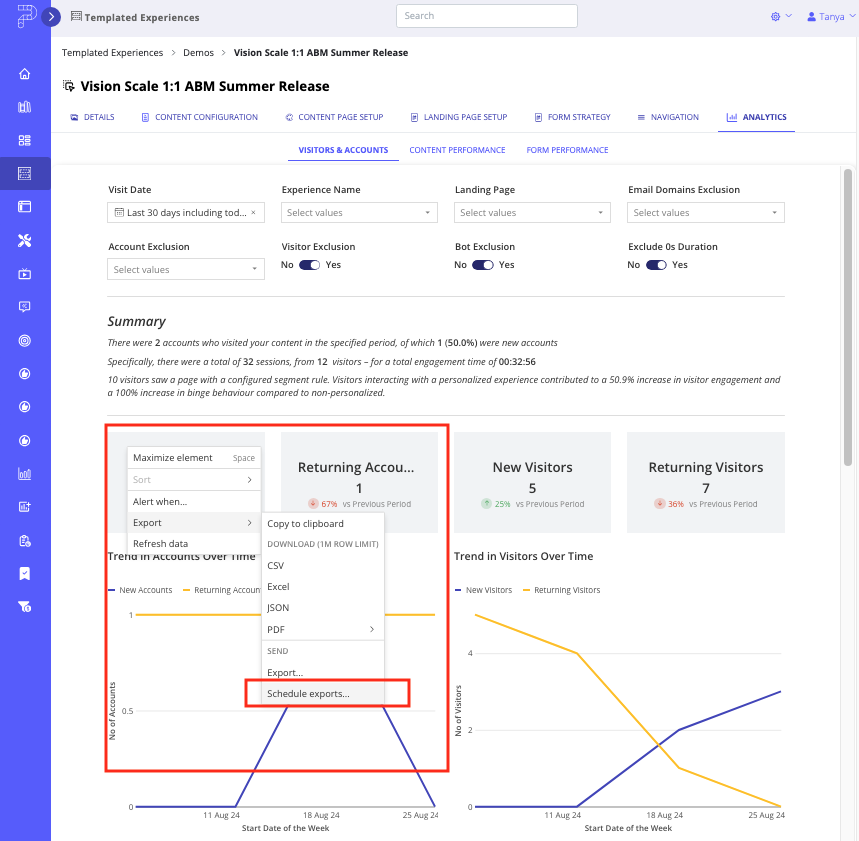
- On the Schedule Exports menu that opens, configure the conditions, attachments, frequency, and other settings to automate future exports.
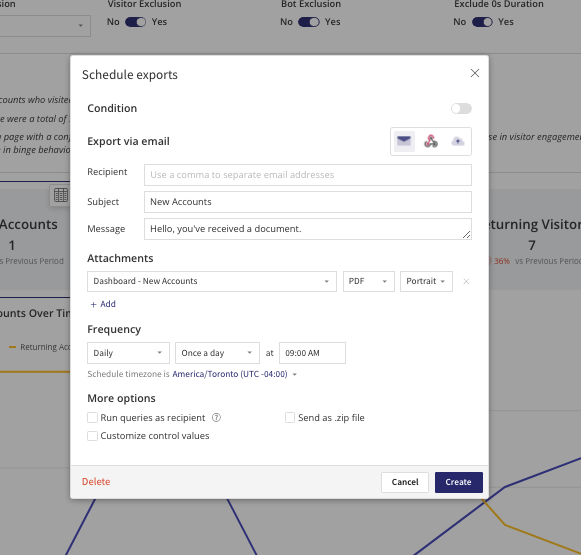
- When you have finished setting up the report, click Create to proceed. To leave without scheduling a report, click Cancel.
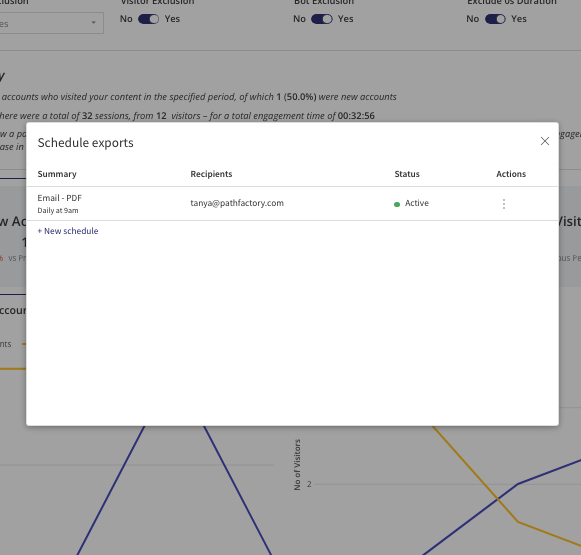
- If you click on Create, a confirmation menu appears. On the confirmation is listed the delivery method, file format, recipients, and status (Active or Inactive).
- To schedule another data export, click the New schedule link.
- To edit a scheduled export, click its three dots in the right-most column and then an option from the dropdown menu.
How to Preview a Scheduled Data Export
To see how your report will look to recipients follow these steps.
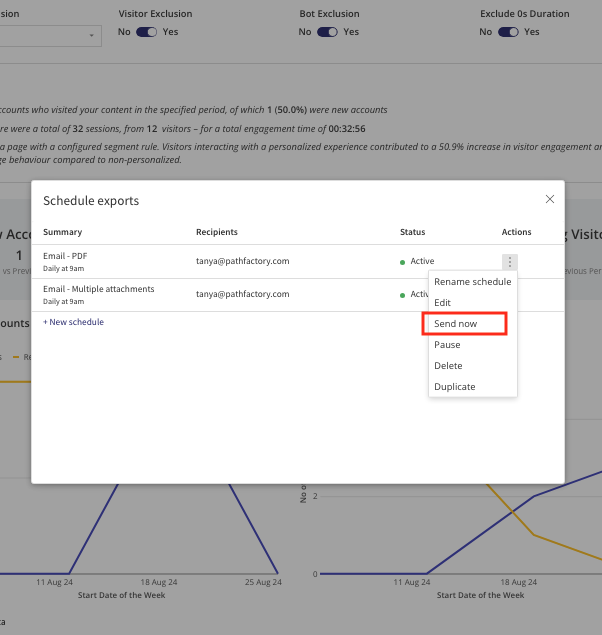
- In the Schedule Exports menu, enter your own email address in the field provided.
- On the confirmation screen, click the three dots and select Send Now. This will send a version of the report to your email address within a few seconds.
Views: 454